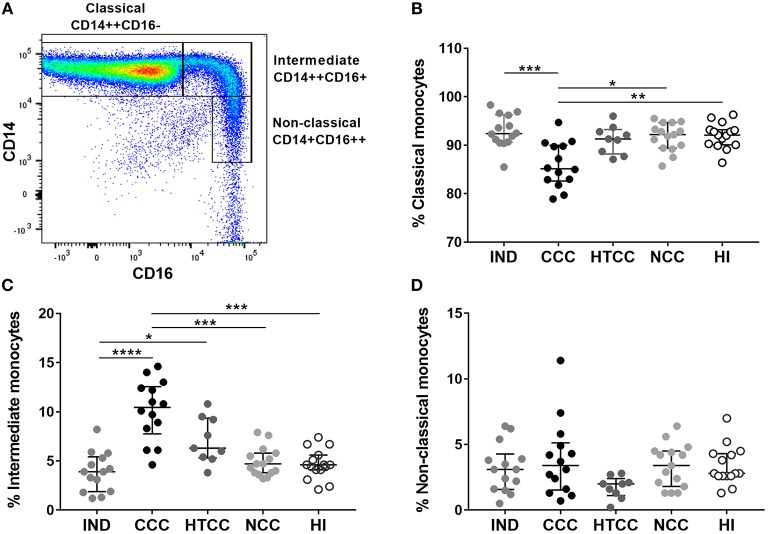
Figure 2.
Analysis of normalized percentages of monocyte subsets in IND (n = 14), CCC (n = 14), and HTCC (n = 9) patients and NCC (n = 15) and HI (n = 15) controls. The strategy used to differentiate the three monocyte subsets according to CD14 and CD16 expression is shown in (A). The percentages of classical (B), intermediate (C), and non-classical (D) monocytes between the groups were compared with the Kruskal-Wallis test followed by Dunn's post-hoc test. The values are presented by median and interquartile ranges and differences are indicating with: *p < 0.05, **p < 0.01, ***p < 0.001, ****p < 0.0001.

