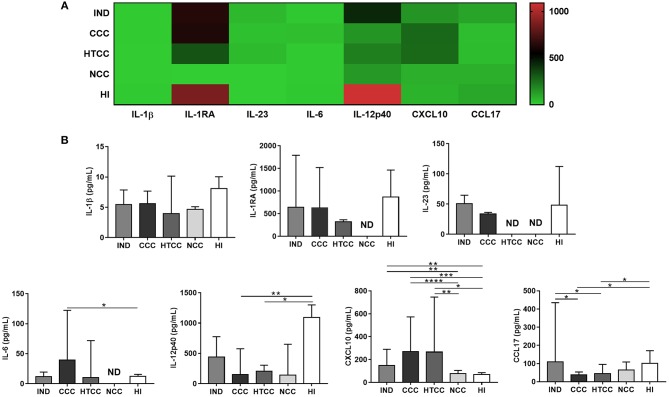
Figure 3.
Cytokines and chemokines concentration in plasma from donors of all groups. Heat map that shows the patterns of cytokines and chemokines concentration in chagasic patients (IND, CCC, and HTCC) and controls (NCC and HI) are distinct (A). Comparison of IL-1β, IL-1RA, IL-6, IL-12p40, IL-23, CXCL10, and CCL17 levels was done with Mann-Whitney test. The median and interquartile ranges of cytokines are displayed (B). ND, Not detectable. Differences are indicated as follows: *p < 0.05, **p < 0.01, ***p < 0.001, ****p < 0.0001.

