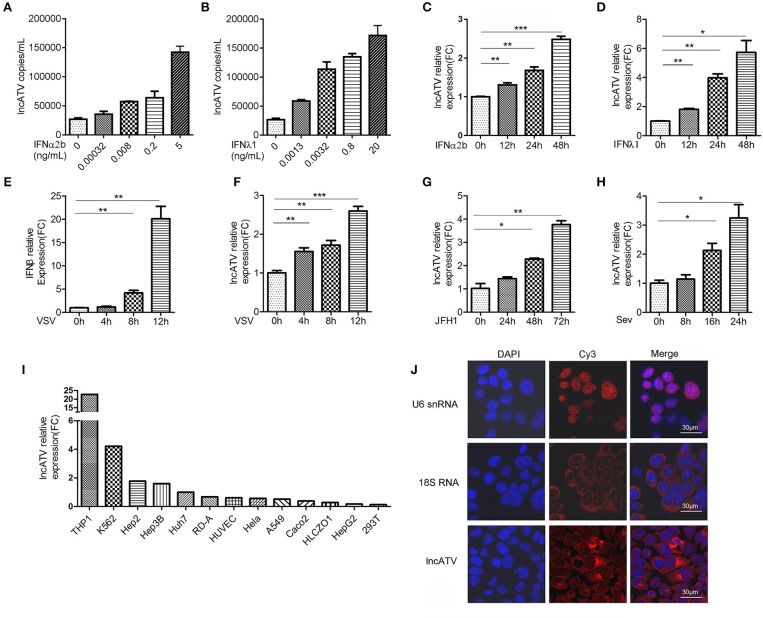
Figure 1.
LncATV is induced by IFNs and virus infections. (A,B) Endogenous LncATV expression levels were analyzed by absolute qRT-PCR in IFNα2b (A) or IFNλ1 (B) stimulated Huh7 cells at different IFN dosages. The treatment duration was set to 48 h. (C,D) Endogenous LncATV expression levels were analyzed by relative qRT-PCR in IFNα2b (C) or IFNλ1 (D) stimulated Huh7 cells at different treatment timepoints. The treatment concentration is 1 ng/mL for IFNα2b and 25 ng/mL for IFNλ1. (E) The levels of IFNβ mRNA were determined by qRT-PCR in Huh7 cells after VSV infection. (F–H) The expression levels of LncATV were analyzed by qRT-PCR in VSV (F), JFH-1 HCVcc (G), or SeV (H) infected Huh7 cells at various infection time points. (I) Quantitative RT-PCR determination of the endogenous lncATV abundance in multiple tissue type derived cell lines. The relative level of lncATV in Huh7 cells was set as 1. (J) RNA FISH detecting the subcellular localization of endogenous lncATV molecules in Huh7 cells. U6 snRNA or 18S RNA specific probes were used as control to indicate nucleus or cytoplasm localization, respectively. Red signals show Cy3-labeled RNAs, and DNA (blue) was stained with DAPI. A representative image is shown. Scale bars, 30 μm. Data are representative of three independent experiments and plotted as the mean ± s.d. *P < 0.05, **P < 0.01, ***P < 0.001 vs. the control group.

