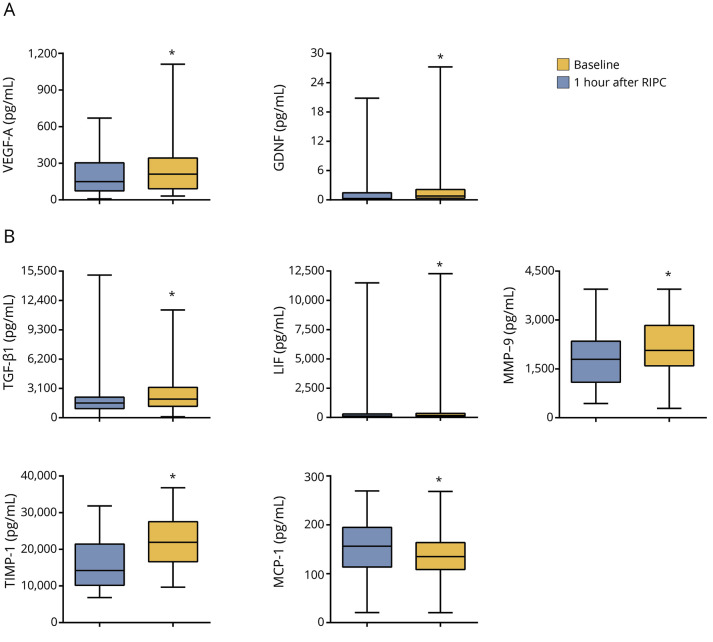
Figure 4. Statistical distributions of 7 biomarkers with significant differences.
(A) Statistical distributions of the neuroprotective factors vascular endothelial growth factor A (VEGF-A) and glial cell line–derived neurotrophic factor (GDNF) at baseline and 1 hour after remote ischemic preconditioning (RIPC) in each group. (B) Statistical distributions of inflammation-related biomarkers transforming growth factor-β1 (TGF-β1), leukemia inhibitory factor (LIF), matrix metalloproteinase-9 (MMP-9), tissue inhibitor of metalloproteinases-1 (TIMP-1), and monocyte chemotactic protein-1 (MCP-1) at baseline and 1 hour after RIPC in each group. Whiskers represent highest and lowest values; middle square represents interquartile values; and middle line indicates median. *Adjusted p < 0.05 for comparison with the baseline level.

