Figure 5.

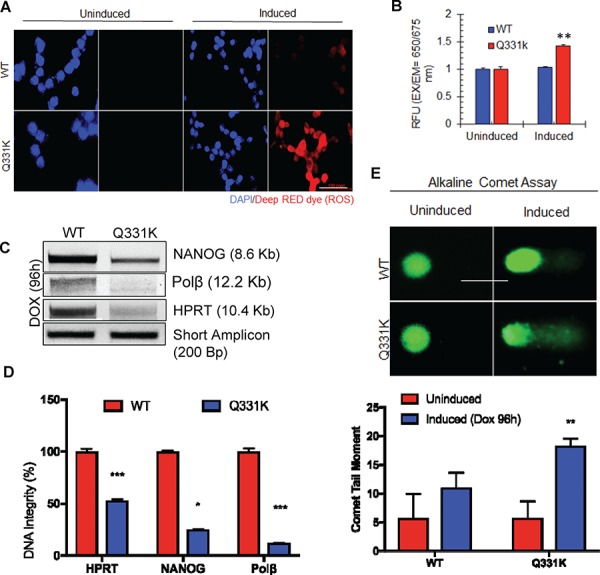
Q331K expression induces ROS stress and accumulation DNA strand breaks in neurons. (A) Cellular Reactive Oxygen Species Detection Assay by IF microscopy. Upper panels represent WT-expressing cells; lower panels represent Q331K-expressing cells. The two panels on the left represent uninduced cells. Panels to the right represent cells after Dox induction. Deep RED dye staining indicates the presence of ROS (Scale bar, 10 μm). (B) Quantitation of cellular ROS using a microplate fluorescence reader. (C) LA-PCR analysis of genomic DNA isolated from TDP-43-Q331K neurons shows reduced DNA integrity. Representative agarose gel images of amplified DNA products. (D) Quantification of PCR products by Pico Green-based DNA quantitation from triplicate experiments. (E) Alkaline comet analysis of differentiated SH-SY5Y cells expressing WT or Q331K (lower panel). Quantitation of mean tail moment before and after Dox induction in 25–50 cells reveals an ~5-fold increase in DNA damage in Q331K cells (Scale bar, 10 μm). *P<0.01; **P<0.05; ***P<0.0005.
