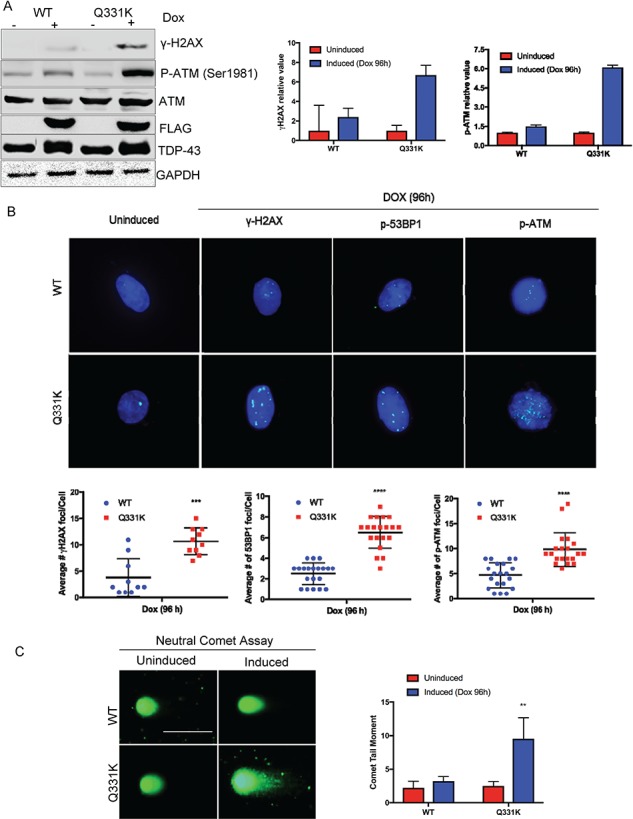
Figure 6.

Activation of DDR signaling in Q331K-expressing neurons. (A) Immunoblots of extracts from inducible Q331K cells before and after Dox induction, probed with γH2AX and p-ATM antibodies. GAPDH served as loading control. Histogram represents quantitation of mean band intensity from three independent experiments. (B) Representative IF image of γH2AX, p53BP1 and p-ATM foci and quantitation of foci (Scale bar, 10 μm). (C) Neutral comet analysis of differentiated SH-SY5Y cells expressing WT or Q331K (lower panel). Quantitation of mean tail moment before and after Dox induction in 25–50 cells reveals an ~3-fold increase in DNA DSBs in Q331K cells (Scale bar, 10 μm). **P<0.05; ***P<0.0005; ****P<0.0001.
