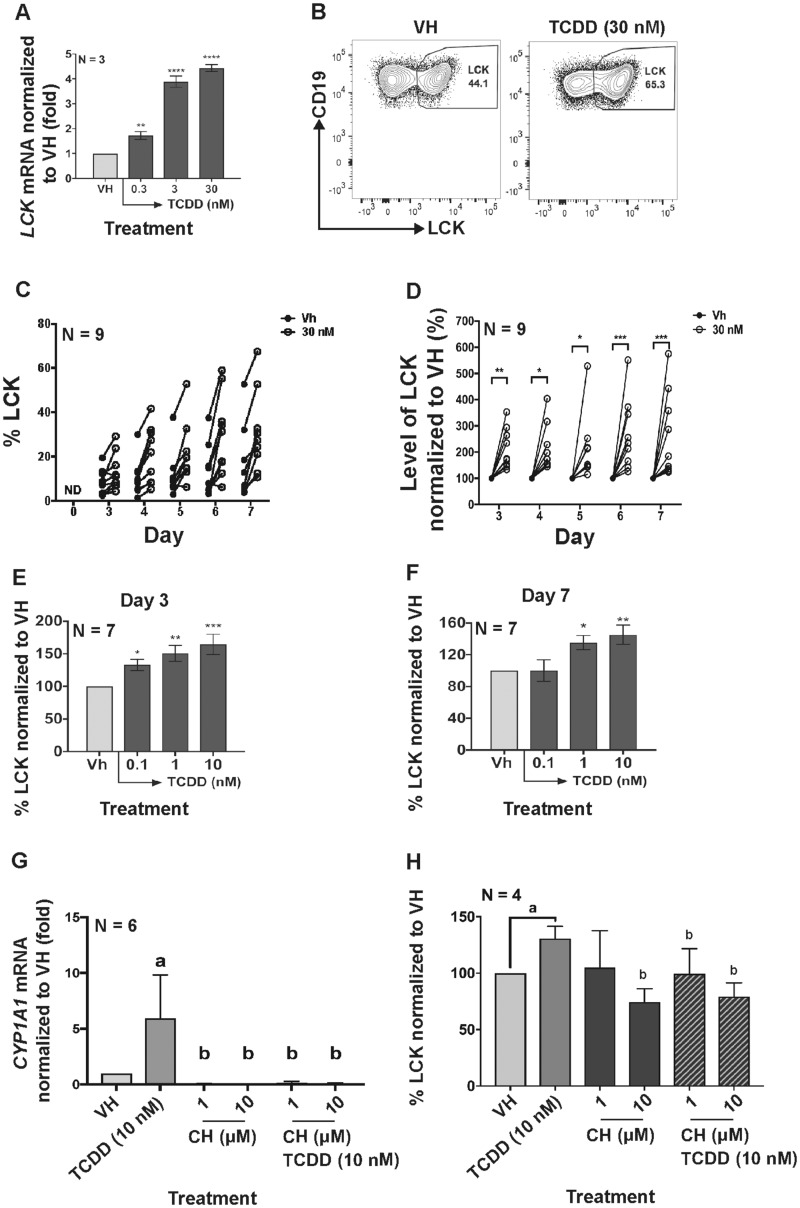
Figure 1.
Aryl hydrocarbon receptor activation increased LCK expression in naïve human primary B cells. (A) Human B cells were treated with VH (0.02% DMSO), or TCDD (0.3, 3, and 30 nM) on day 0 and cultured for 3 days. mRNA levels of LCK as determined by real-time qPCR in B cells on day 3. (B) B cells were treated with VH (0.02% DMSO), or TCDD (30 nM) and cultured for 7 days. Flow cytometry dot plot of intracellular LCK in B cells with VH or TCDD treatment on day 7. Human B cells were treated with VH (0.02% DMSO) or TCDD (10 nM) for 7 days. Cells were collected on days 3–7 to analyze the LCK protein level. (C) Un-normalized percent positive LCK in B cells on day 0 (background) and days 3–7 post B-cell activation. (D) Normalized percent LCK positive B cells with VH or TCDD (30 nM) treatment from day 3 to day 7. Days 1 and 2 were excluded from the graph due to undetectable levels of LCK in human B cells. The circular dot indicates one individual human donor. Percent LCK positive B cells on (E) day 3 and on (F) day 7 measured by flow cytometry. Significant differences from VH control are indicated by *p<.05, **p<.01, ***p<.001 by 1-way ANOVA following by Fisher’s LSD post hoc test. Naive human primary B cells were treated with AHR antagonist, CH-223191 (CH) or a combination of both CH and TCDD (10 nM) on day 0. (G) CYP1A1 mRNA induction with TCDD, TCDD and CH-223191 (CH) treatments on day 1. (H) Percent LCK positive B cells on day 7. Two-way ANOVA followed by Fisher’s LSD post hoc test has been performed to compare all treatment groups. Significant differences from VH control are indicated by a (p<.05); significant differences from the TCDD group are indicated by b (p<.05). Results are presented as the normalized percentage compared to the VH group. “N” indicates the number of donors used in the study.

