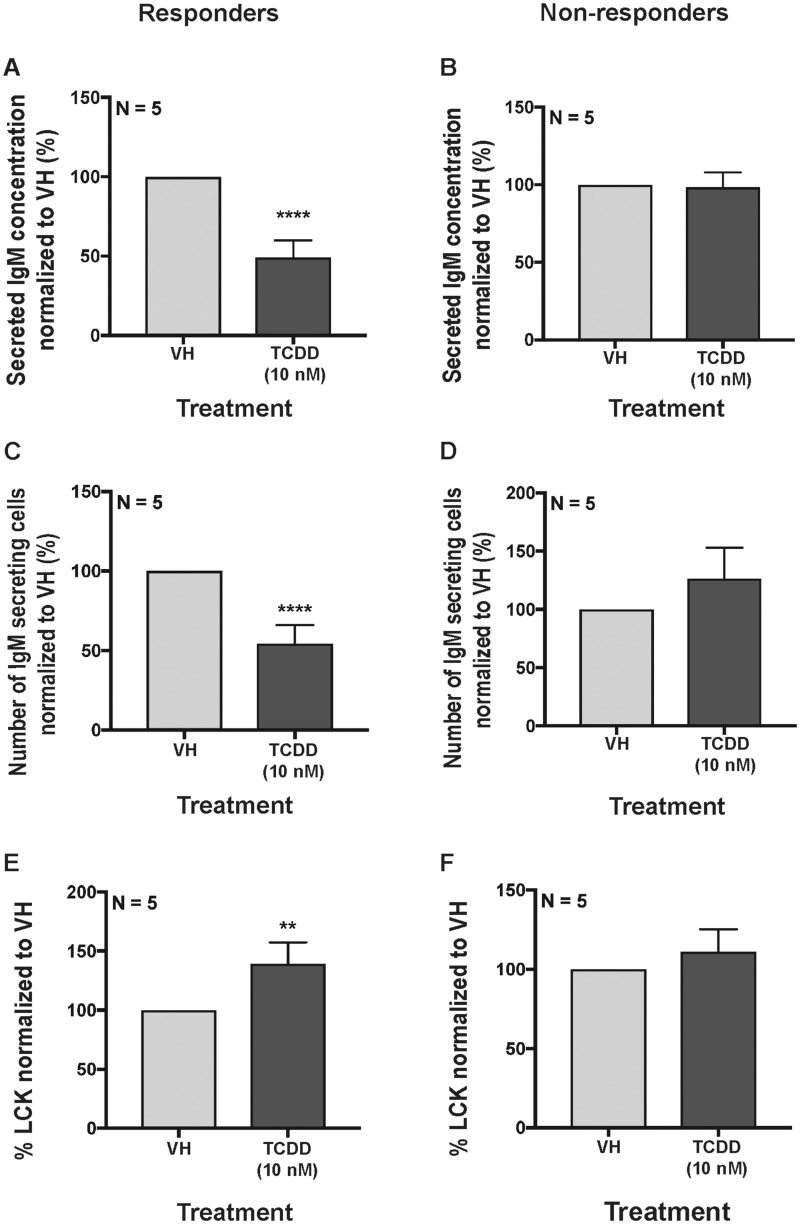
Figure 8.
Comparison of total LCK expression levels in responsive and nonresponsive donors. B cells were treated with VH (0.02% DMSO) or TCDD (10 nM) and activated by coculture with CD40 ligand expressing L cells plus cytokines (IL-2, IL-6, and IL-10) for 7 days. The IgM concentration in culture supernatants in (A) responders and (B) nonresponders. Number of IgM secreting B cells in (C) responders and (D) nonresponders. Percent LCK positive human B cells in (E) responders and (F) nonresponders. Significant differences from VH control are indicated by **p<0.01 and ****p<0.0001 by Student’s t-test. Results are presented as the normalized percentage compared with the VH control group. “N” indicates the number of donors used in the study.

