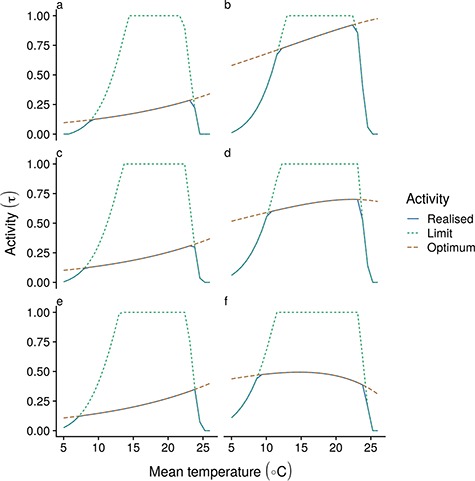
Figure 4.

Optimum (red long-dashed), maximum (green short-dashed) and realized (blue solid lines) activity levels (left column) at increasing temperatures through ontogeny for a for fish with a cm at 1.25 g (5 cm; a–b); 10 g (10 cm; c–d) and 80 g (20 cm; e–f), for slow strategy (slow life history; left column [a,c,e]) and fast strategy (fast life history; right column [b,d,f]) species with a dome-shaped MMR with respect to temperature.
