
Figure 6.
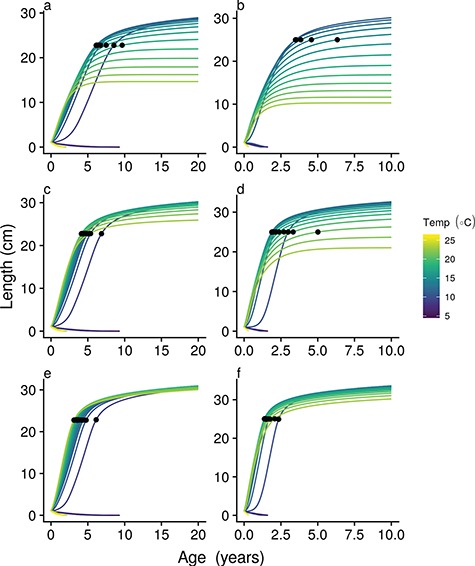
On ecological timescales, increasing temperature (purple to yellow growth curves) modifies growth, and maturation age changes according to the reaction norm (black dots at 50% allocation to reproduction), whereas asymptotic size is affected by changes in absolute energy available for growth. Growth curves are shown for slow (left column [a,c,e]) and fast strategists (right column [b,d,f]), at increasing food availability from top (a/b) to bottom (e/f). Baseline resource availability assumed in all other simulations is that shown in panels c and d.