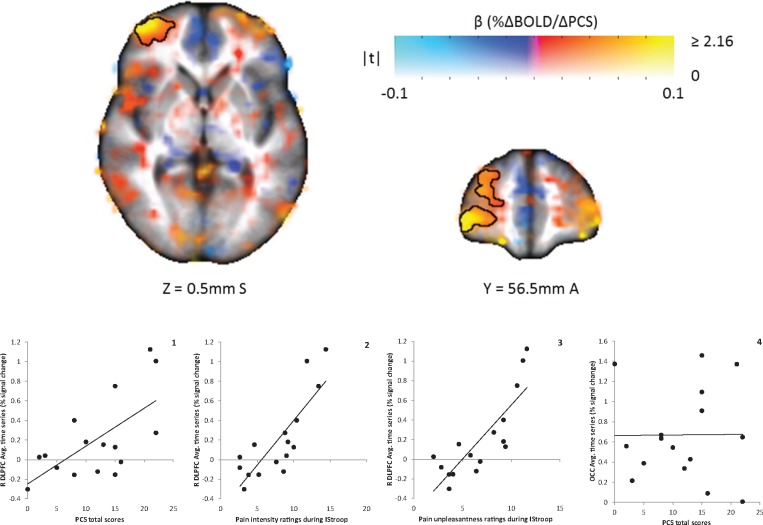
Figure 4.
Map of association between PCS total scores and BOLD responses to cognitive modulation of pain during the incongruent Stroop task in 16 fibromyalgia patients. Color represents the β coefficient, and opacity represents the t-statistic, with full opacity at a voxelwise t corresponding to P < 0.05. The single cluster significant at α < 0.05 (corresponding to a cluster size threshold of 73 voxels) is outlined. A significant positive correlation was found in the right dorsolateral prefrontal cortex (DLPFC; graph 1). Graphs 2 and 3 show the relationships between the brain response in the right DLPFC and pain intensity and unpleasantness ratings to pain stimuli delivered during the incongruent Stroop task. There was not a significant relationship between PCS scores and brain responses in the occipital lobe (OCC; control region, graph 4). Average cluster values (percent signal change) for each individual were extracted and are shown plotted against PCS scores and pain ratings. L = left; R = right.

