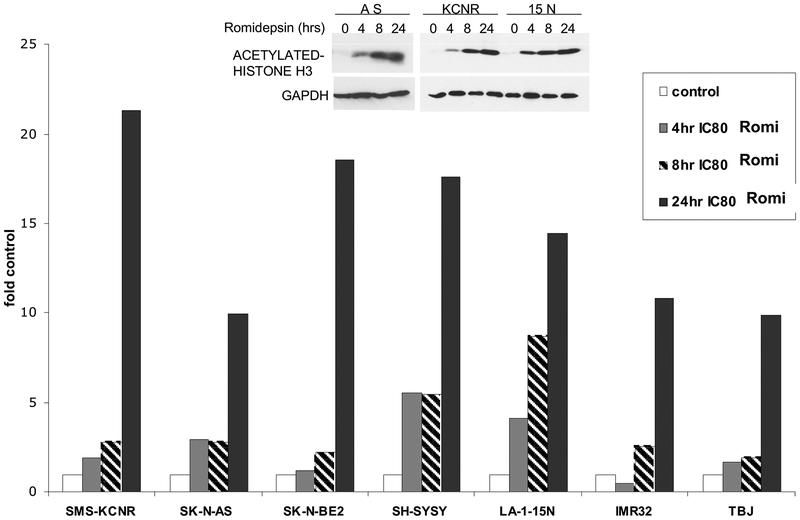
Figure 2-.
Acetylation of histones after romidepsin treatment. NB cell lines were treated with IC80 concentration of romidepsin for 4, 8 and 24 h, protein was extracted and analyzed for Ac-H3 analysis by immunoblot assay. Blots were reprobed for glyceraldehyde-3-phosphate dehydrogenase (GAPDH) levels as loading controls. Normalized values are plotted as ratio of control. Inset- Representative western analyses of acetylated Histone H3.

