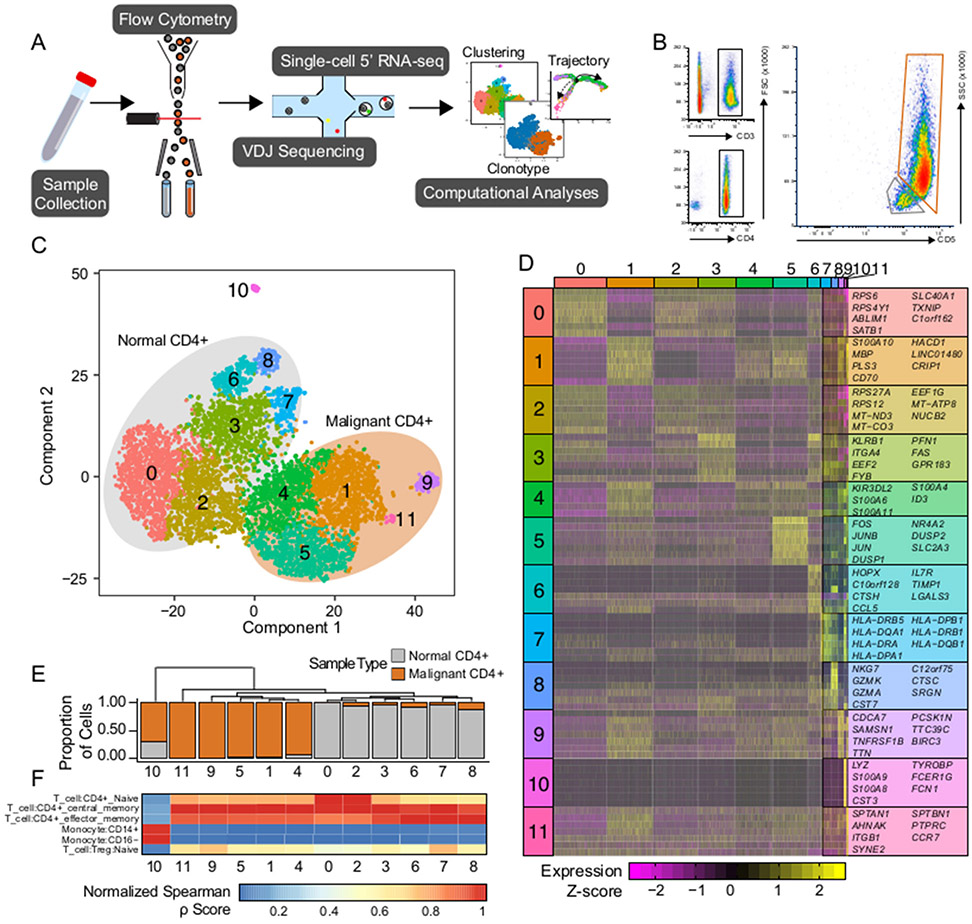
Figure 1. Single-cell isolation and sequencing of peripheral blood and Sézary Syndrome cells.
(A) Schematic of the isolation, sequencing, and analysis of the single-cells. (B) Flow cytometry gating of the patient sample to isolate peripheral blood and tumor cells. (C) tSNE projection of patient sample with normal peripheral blood samples (n=4436) outline in grey and tumorigenic CD4 cells (n=3443) in orange. (D) Unique significant cluster genes without overlap between clusters and based on the Wilcoxon rank sum test, adjusted P-value < 1e-50. (E) Phylogenic tree of cluster identities based on mean mRNA values in the cluster with corresponding cluster proportion of cells composition. (F) Quantile-normalized Spearman correlation values of predicted immune cell phenotype based on SingleR algorithm for each tSNE cluster.

