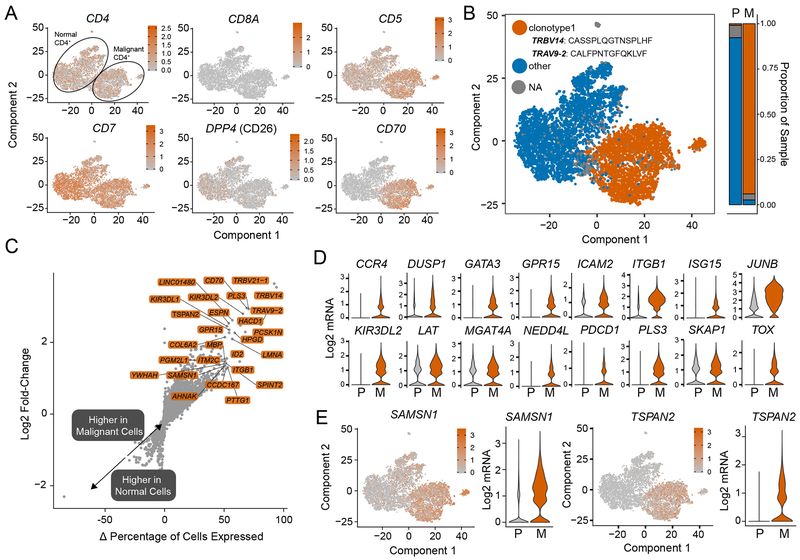
Figure 2. Transcriptomic comparison of malignant versus normal CD4+ T cells.
(A) tSNE projects of common markers used to diagnose CTCL (B) VDJ sequencing of malignant CD4+ T cells examining the distribution of a single prominent clonotype in the malignant T cells (orange) (C) Log2-fold change expression versus the difference in the percent of cell expressing the gene comparing malignant to normal peripheral blood CD4+ T cells (Δ percentage of cells expressed). Genes labeled have a Δ percentage of cells expressed > 50%, log2-fold change > 1 and an adjusted p-value < 0.05. (D) Potential novel markers of CTCL cells with a Δ percentage of cells expressed greater than 50% and adjusted p-values < 1e-100. (E) Violin plots of previously identified markers of CTCL (adjusted P < 1e-10).

