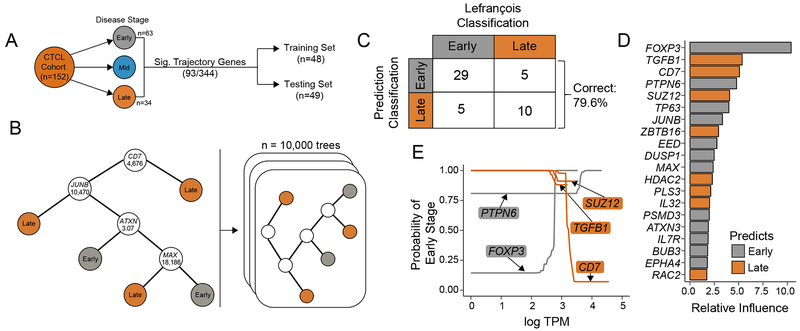
Figure 4. Predictive clinical correlates in CTCL using SS single-cell heterogeneity.
(A) Representative schematic of the composition of SRP114956 and the separation into training and testing sets for prediction of clinical stage. (B) A hypothetical classification decision tree is constructed to predict the CTCL stage based on RNA-seq expression data for each patient in the training set (n=48). At each branch in the tree, the patient’s transcripts per million (TPM) for a given gene are compared to a cutoff value. If the patient’s TPM are below the cutoff, the algorithm proceeds to the left and vice versa, until a terminal classification node is reached. A series of 10,000 boosted trees are grown in sequence utilizing information from previous trees, improving upon previous misclassifications. (C) The independent test patient data set (n=49) is applied to the 10,000 boosted classification trees and predicted disease states are compared to original classifications. Overall, the boosted decision trees correctly classify 79.6% of the disease states. (D) The 20 most important genes in generating the boosted classification trees are quantified and displayed in a ranked variable importance plot. Bar color logic is described below. (E) Partial dependence plots for the five most important variables represent how different levels of gene expression (log TPM) effect the probability of early-disease classification after integrating out the expression of all other genes. Genes with high expression predictive of early disease are colored in grey, while high gene expression more predictive of late stage disease are colored in orange.

