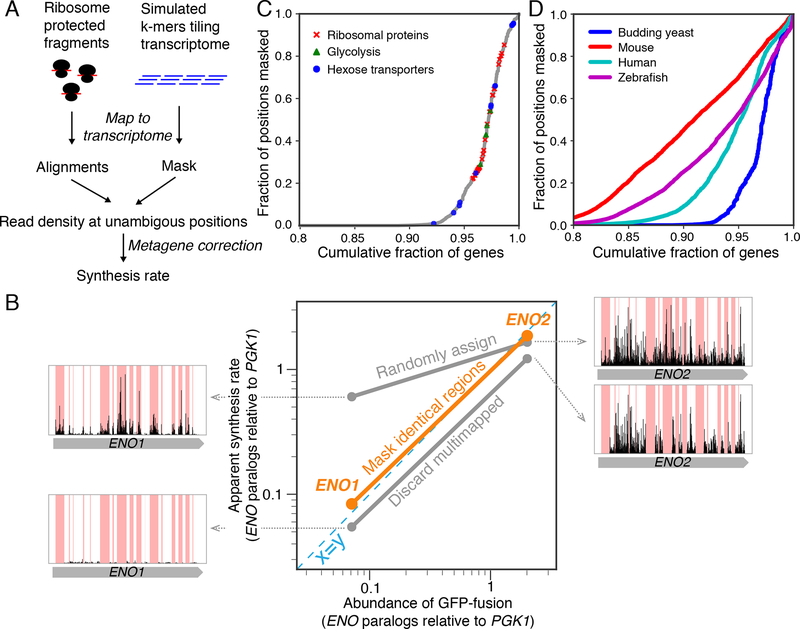
Figure 1. Simple masking strategy ensures correct estimate of protein synthesis rates.
A. Computational workflow for the masking strategy. B. Comparison of enolase paralog abundances (relative to the upstream phosphoglycerate kinase, Pgk1) with apparent synthesis rates estimated by three read-mapping strategies. Misassigned ribosome density for enolase paralogs was shown for each of the commonly used read-mapping strategy. C. Yeast genes ranked by the fraction of their sequences that are not unique. Genes whose products are ribosomal proteins, glycolytic enzymes, and hexose transporters are highlighted. D. Same as C, with data for higher eukaryotes.

