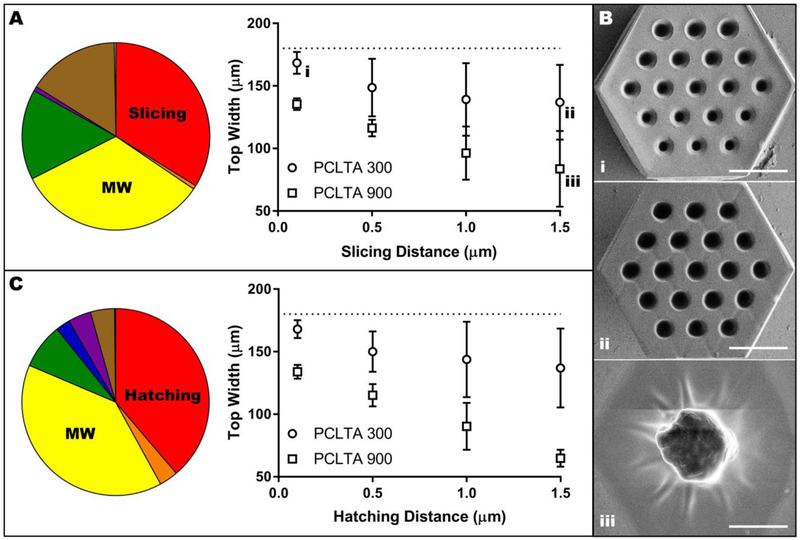
Figure 4.
Influence of slicing distance, hatching distance and molecular weight on scaffold width. A) Pie chart representing the contribution of experimental variables on scaffold width with constant hatching of 0.5 μm and a consolidated graphical analysis showing only the effect of slicing distance and molecular weight (data points were averaged across all polymer concentrations). Lower case Roman numerals are a cross-reference to Panel B. B) Representative images of the effect of slicing distance and molecular weight on the width of PCL scaffolds: 300 g/mol with 0.1 μm slicing distance (i), 300 g/mol with 1.5 lm slicing distance (ii), and 900 g/mol with 1.5 μ m slicing distance with all other variables held at 75 wt% prepolymer and 0.5 μ m hatching distance. Scale bars represent 50 μm. C) Pie chart representing the contribution of experimental variables on scaffold width with constant slicing of 0.5 μm and a consolidated graphical analysis showing only the effect of hatching distance and molecular weight (data points were averaged across all polymer concentrations). In A and C, the dotted line indicates the designed width of 180 μm and the colors represent the following variables: red, slicing or hatching distance; orange, interaction between slicing or hatching distance and molecular weight; yellow, molecular weight; green, interaction between molecular weight and prepolymer concentration; blue, prepolymer concentration; purple, interaction between prepolymer concentration and slicing or hatching distance; brown, interaction between slicing or hatching distance, molecular weight and prepolymer concentration; grey, other.

