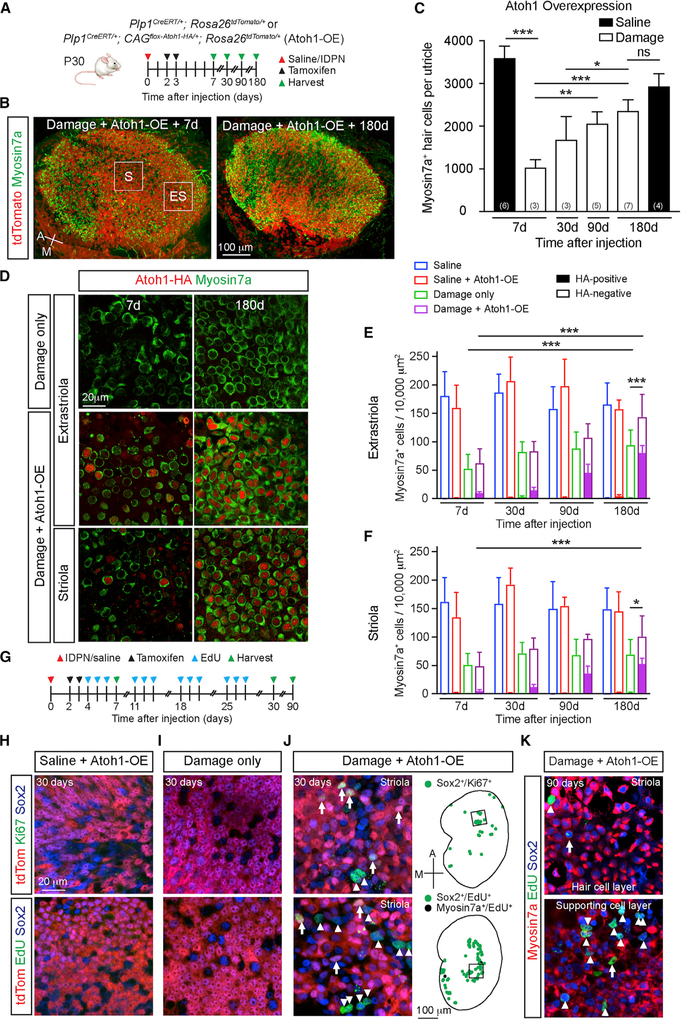
Figure 2. Atoh1 OE Enhances HC Regeneration and Proliferation.
(A) Schematic for tracing and Atoh1 OE in Plp1+ support cells. Atoh1 OE cells were detected via tdTomato/HA labeling.
(B) Robust repopulation of Atoh1 OE, damaged utricles with tdTomato+ HCs. Boxes represent extrastriolar and striolar regions where high-magnification images were taken.
(C) Quantification of total HCs post-treatment (IDPN or saline) and Atoh1 OE.
(D) Representative images of the extrastriola and striola after damage alone or with Atoh1 OE. No HA+ cells were identified after damage alone. HA+ HCs were detected after damage and Atoh1 OE.
(E and F) Extrastriolar (E) and striolar (F) HC density in undamaged, damaged only, Atoh1 OE, undamaged, and Atoh1 OE, damaged tissues.(G) Schematic to ablate HCs, fate-map Plp1+ support cells, and Atoh1 OE. EdU was given to label mitotic cells.
(H and I) No Ki67+ or EdU+ cells were detected in the sensory epithelium of either Atoh1 OE, undamaged (H) or damage-only (I) utricles at 30 days.
(J) Ki67+ and EdU+ support cells were detected 30 days after damage and Atoh1 OE, particularly in the striola. tdTomato-positive (arrow) and tdTomato-negative (arrowheads) proliferative (Ki67+ or EdU+) cells. Drawings depicting location of proliferative Sox2+ (green) and Myosin7a+ (black) cells; black boxes represent striolar regions where images were captured.
(K) Ninety days after damage and Atoh1 OE, many EdU+ cells were still detected in the striola, consisting of EdU+/Sox2+/Myosin7a− support cells (arrowheads) and EdU+/Sox2+/Myosin7a+ HCs (arrows).
One-way ANOVA with Tukey’s multiple comparisons test (C), two-way ANOVA with Tukey’s multiple comparisons test (E and F), n for utricles. *p < 0.05; **p < 0.01, ***p < 0.001. Data are shown as mean ± SD.

