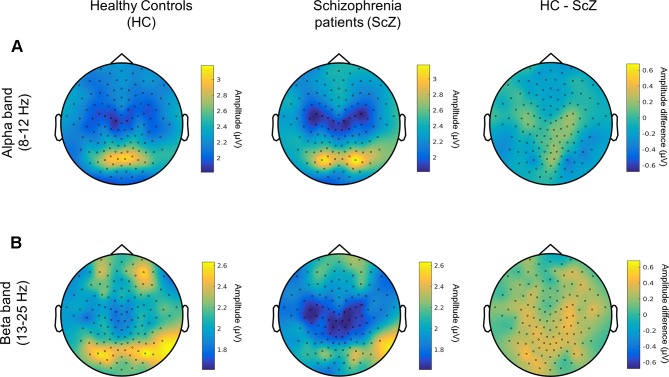
Figure 3.
Amplitude of alpha and beta neuronal oscillations in HC and SCZ (A) Topographical distribution of the amplitude of alpha oscillations (8–12 Hz) is displayed for HC (left) and people with SCZ (middle). The difference between the two groups is also shown (HC-SCZ; right). A cluster-based permutation test showed that there is no significant difference in the amplitude of alpha oscillations between the two groups. (B) Topographical distribution of the amplitude of beta band oscillations (13-25 Hz). The cluster-based analysis showed that the amplitude of beta oscillations did not significantly differ between HC and SCZ.

