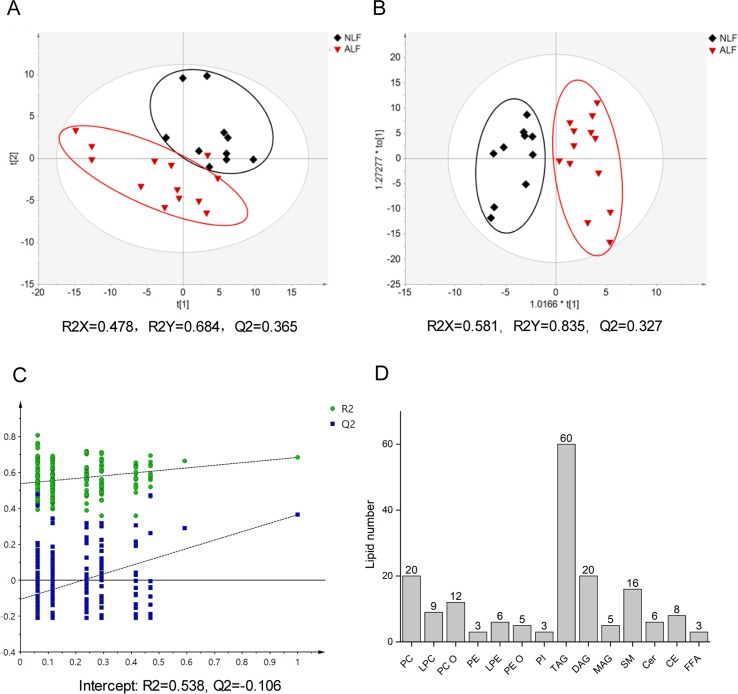
Figure 1.
Score plot of the PLS-DA model (A) and the OPLS-DA model (B) based on UV scaling for ALF subject (red dots) and NLF (black dots) separation. (C) Cross-validation plot of PLS-DA mode with 200 times permutation tests. (D) Number of detected lipids based on a nontargeted lipidomics strategy in patient serum.

