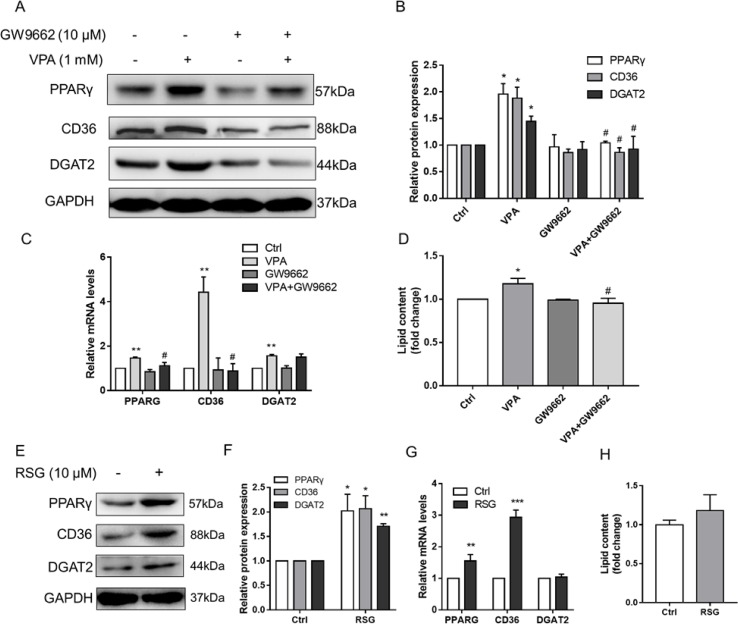
Figure 8.
Effect of PPARγ pathway on VPA-induced lipid accumulation. L02 cells were pretreated with a PPARγ antagonist (GW9662, 10 µM) for 1 h and then treated with VPA (1 mM) for 24 h (A–D) or treated with PPARγ agonist (rosiglitazone, 10 µM) for 24 h (E–H). The protein expression levels of PPARγ, CD36, DGAT2, and the internal control (GAPDH) were analyzed by Western blot (A, B, E, F). A representative blot is shown. The mRNA levels of PPARG, CD36, and DGAT2 were analyzed by real-time PCR (C, G). The lipid contents were determined by kit normalized by protein (D, H). Results are expressed as mean ± SD (n = 3); *P < 0.05, **P < 0.01, ***P < 0.001 compared with the control group; # P < 0.05 compared with VPA group.

