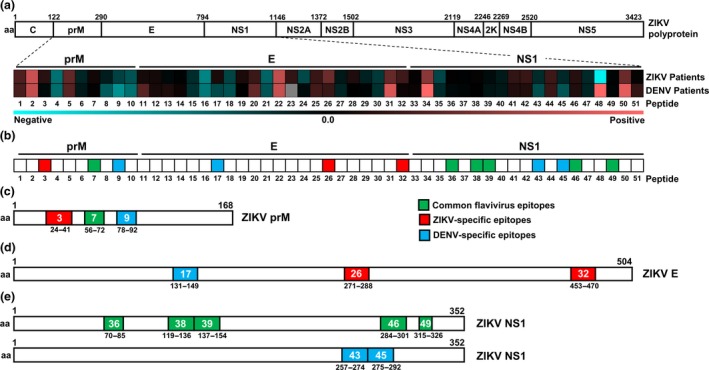
Figure 2.

Mapping of common flavivirus, ZIKV‐specific and DENV‐specific linear B‐cell epitopes using ZIKV and DENV patient samples. (a) Polyprotein of ZIKV H/PF/2013 (UniProtKB accession: A0A024B7W1). Plasma samples of ZIKV patients (n = 30–44) and serum samples of DENV patients (n = 20) at late convalescent phase were tested at 1:2000 dilution in a peptide‐based ELISA in duplicates, using peptides that cover the precursor of membrane (prM: peptides 1–10), envelope (E; peptides 11–32) and non‐structural 1 (NS1; peptides 33–51) proteins of ZIKV and DENV proteome. IgG response of patients was normalised to mean of pooled healthy control. Patients’ response to ZIKV and DENV peptide pairs was compared, and the mean binding capacity is presented in a heat‐map. A value of 0 on the scale denotes patients showing equal binding response to a ZIKV and DENV peptide pair, whereas values larger than 0 show preferential of patients to bind to ZIKV peptide. Values smaller than 0 show binding preference of patients to DENV peptide. (b) A schematic representation to denote common flavivirus (green), ZIKV‐specific (red) and DENV‐specific (blue) peptides across prM, E and NS1 based on the heat‐map analysis above. (c–e) Genome organisation of ZIKV prM, E and NS1. Regions of amino acids corresponding to the identified linear B‐cell epitopes in (c) prM, (d) E and (e) NS1 are shown, with green areas denoting common flavivirus, red denoting ZIKV‐specific and blue denoting DENV‐specific epitopes. Numbers in coloured boxes denote the peptide number and the amino acid position in the respective proteome.
