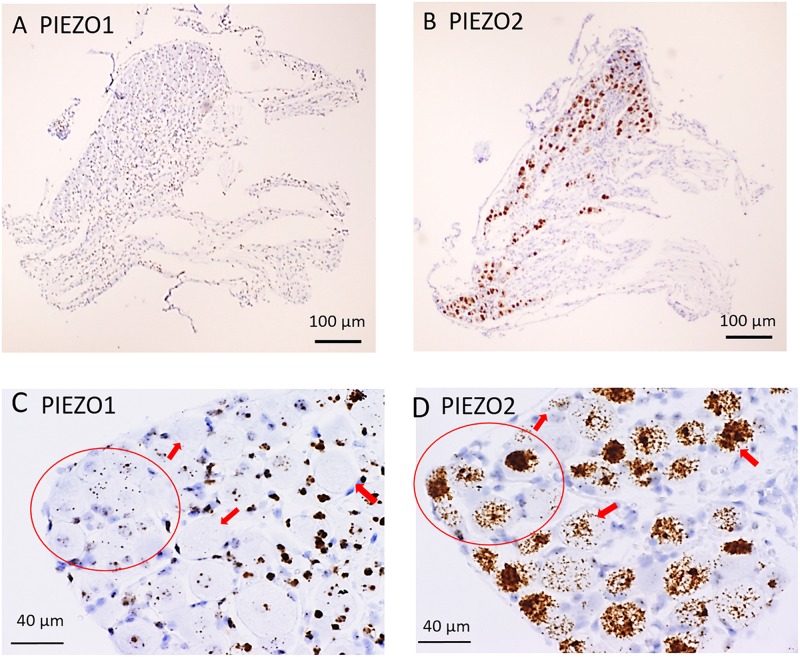
FIGURE 1.
PIEZO1 and PIEZO2 expression in mouse DRG. (A,B) Adjacent DRG slices viewed at low magnification (10× objective) showing faint brown punctuate staining by the PIEZO1 RNA probe (A) and dark brown staining with the PIEZO2 probe (B). (C,D) Specific DRG regions examined at higher magnification (40× objective). The red circles circumscribe several (∼10) small DRG neurons with punctuate PIEZO1 probe staining (C) as well as five larger neurons with denser PIEZO2 probe staining (D). The red arrows indicate large neurons with variable densities of PIEZO2 probe staining (D) but no staining by the PIEZO1 probe (C).

