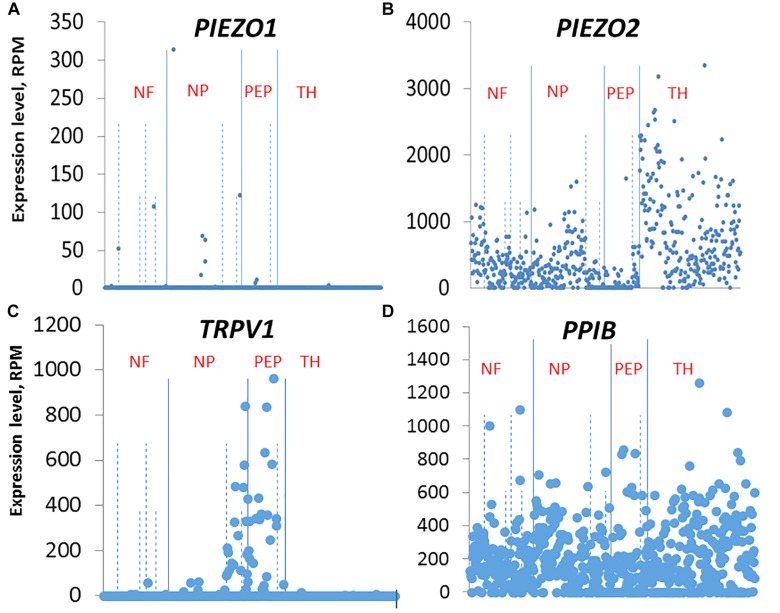
FIGURE 11.
Single cell RNA-sequencing scatter plots for PIEZO1 (A), PIEZO2 (B), TRPV1 (C), and PPIB (D) taken from Usoskin et al. (2015) (see http://linnarssonlab.org/drg/). The vertical axis represents the normalized gene expression levels in reads per million (RPM) for individual cells. The RPM counts are grouped along the horizontal axis according to identified populations separated by the solid vertical lines in the order: NF, NP, PEP, TH populations (NF, Neurofilament; NP, Non-Peptidergic; PEP, Peptidergic; and TH, tyrosine hydroxylase). The dashed vertical lines separate major populations into further subtypes, for example NF1 to NF5 for NF major type.

