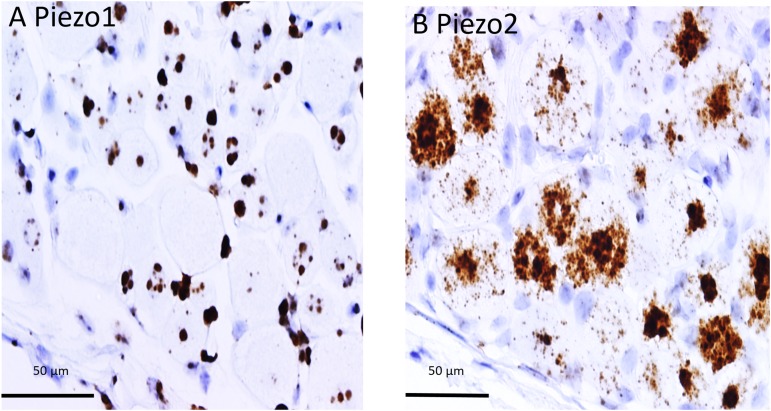
FIGURE 2.
Comparison of PIEZO1 and PIEZO2 expression examined at high magnification (60× objective). Adjacent DRG slices stained with PIEZO1 and PIEZO2 probes indicating while most neurons express PIEZO2 (B) several of the large neurons show zero or minimal PIEZO1 expression (A). Also the several small cells in (B) that surround neurons and appear universally stained blue with the hematoxylin counterstain are unstained by the PIEZO2 probe (B) but at least some are heavily stained by the PIEZO1 probe (A).

