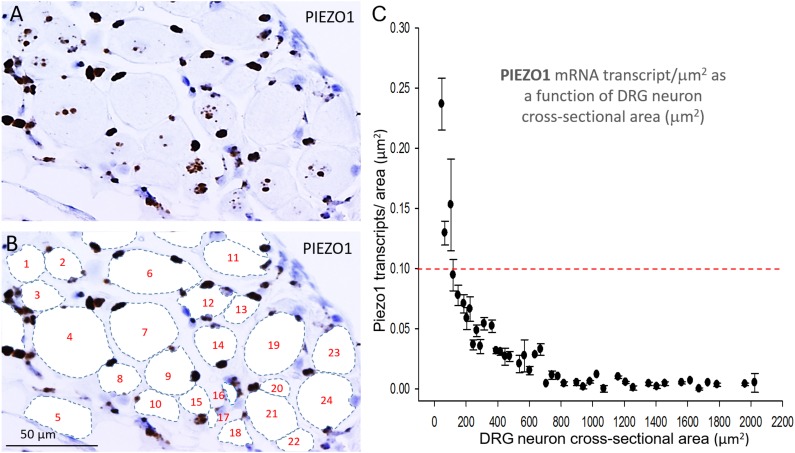
FIGURE 3.
PIEZO1 expression varies with DRG cell size. (A) DRG cells stained with the PIEZO1 RNA probe. Note the absence of PIEZO1 expression in many of the largest neurons in contrast to relatively high expression in some of the smallest neurons. (B) The same microscopic field in which each neuron’s perimeter has been traced out to better define their cross-sectional area which has been numbered for identification. Following this procedure, individual neurons can be seen to be “ringed” by several smaller cells, consistent with satellite glial cells, that are heavily stained by the PIEZO1 probe. (C) A plot showing the relationship between PIEZO1 transcript densities normalized for neuronal cross-sectional area (transcripts/μm2) plotted as a function of DRG neuronal cross sectional area (μm2). The data represent transcripts counted in 167 neurons with each data points representing the mean ± SEM for 2–7 neurons. The red dashed line at 0.1 transcript/μm2 is drawn for comparison with the median expression of the house keeper gene PPIB (e.g., see Figure 4).

