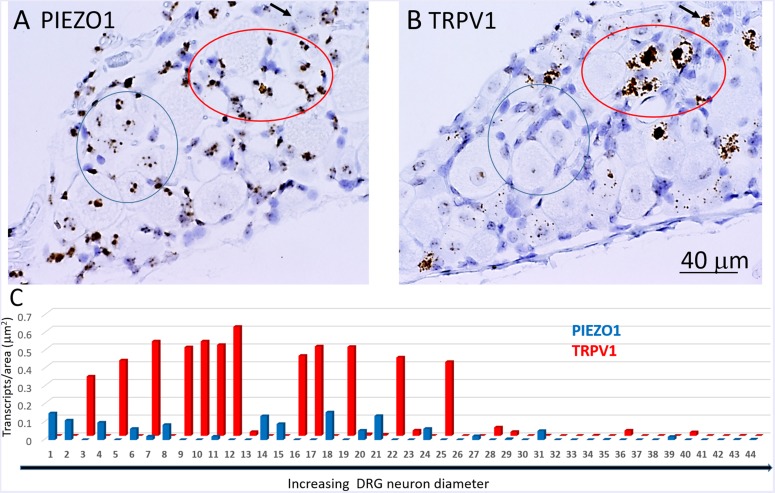
FIGURE 6.
Co-expression of PIEZO1 and TRPV1 in a DRG. (A) DRG slices stained with the PIEZO1 RNA probe. (B) The adjacent DRG slice stained with the TRPV1 probe. The red oval designate a region in which at least three neurons are heavily stained with the TRPV1 probe (B) whereas in the same region the PIEZO1 probe stains only SGCs (A). The blue ovals designates another region in which there is clear punctate staining by the PIEZO1 probe (A) but no staining by the TRPV1 probe (B). The black arrow in the upper right quadrant in each panel designates on neuron that does show strong expression of TRPV1 (B) and also punctate expression of PIEZO1 (A). Note the TRPV1 probe, unlike the PIEZO1 probe, does not stain SGCs. (C) A plot of 44 neurons identified in adjacent slices that were analyzed for PIEZO1 and TRPV1 co-expression. The 44 neurons are number according to increasing cross-sectional area with a range of 90-2070 μm2. Neuron #26 that showed no expression of PIEZO1 or TRPV1 had an area 565 μm2.

