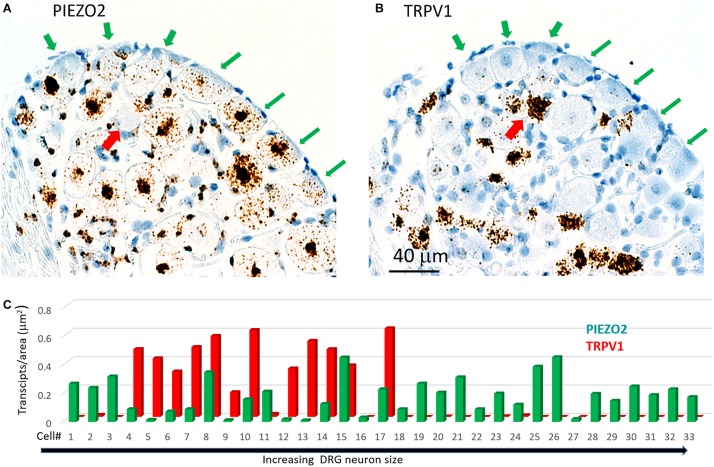
FIGURE 7.
Co-expression of PIEZO2 and TRPV1 in DRG cells. (A) A DRG section stained by the PIEZO2 probe. (B) The adjacent DRG section stained with the TRPV1 probe. Note the selective expression of PIEZO2 over TRPV1, particularly in the neurons indicated by the green arrows. Whereas almost all neurons in this section showed some staining by the PIEZO2 probe (≥90%) less than 50% were stained by the TRPV1 probe and these were the smaller neurons. The red arrow indicates at least one neuron heavily stained by the TRPV1 probe that was not stained by the PIEZO2 probe. (C) Analysis of co-expression of PIEZO2 and TRPV1 in 33 neurons identified in adjacent slices. The neurons were numbered in increasing cross-sectional area with a range of 100–1900 μm2. Neuron #18 had an area of 648 μm2 (Note these neurons are not the same as in Figure 6C).

