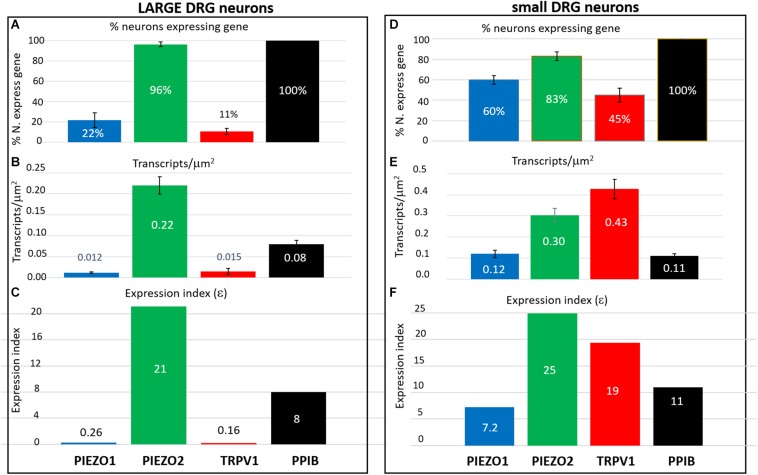
FIGURE 8.
Expression index (ε) estimated for different genes in larger versus smaller DRG neurons. Left, Gene expression parameters estimated in analysis of 257 larger neurons (≥600 μm2). (A) Histograms showing the percentage of neurons expressing PIEZO1, PIEZO2, TRPV1, and PPIB genes. (B) Histograms showing the measured average gene transcript density (transcripts/μm2) in neurons that expressed the specific gene. (C) Histograms of the expression index calculated as the product of the % of neurons expressing the gene and their average transcript density (transcripts/μm2). Right, Expression parameters for 354 smaller neurons (≤500 μm2). (D) Histograms showing the percentage of neurons expressing PIEZO1, PIEZO2, TRPV1, and PPIB genes. (E) Histograms showing their average transcript density (transcripts/μm2) in neurons that expressed the specific gene. (F) Histogram of the expression index calculated as the product of the percentage of neurons expressing the gene and their average gene density transcripts/μm2.

