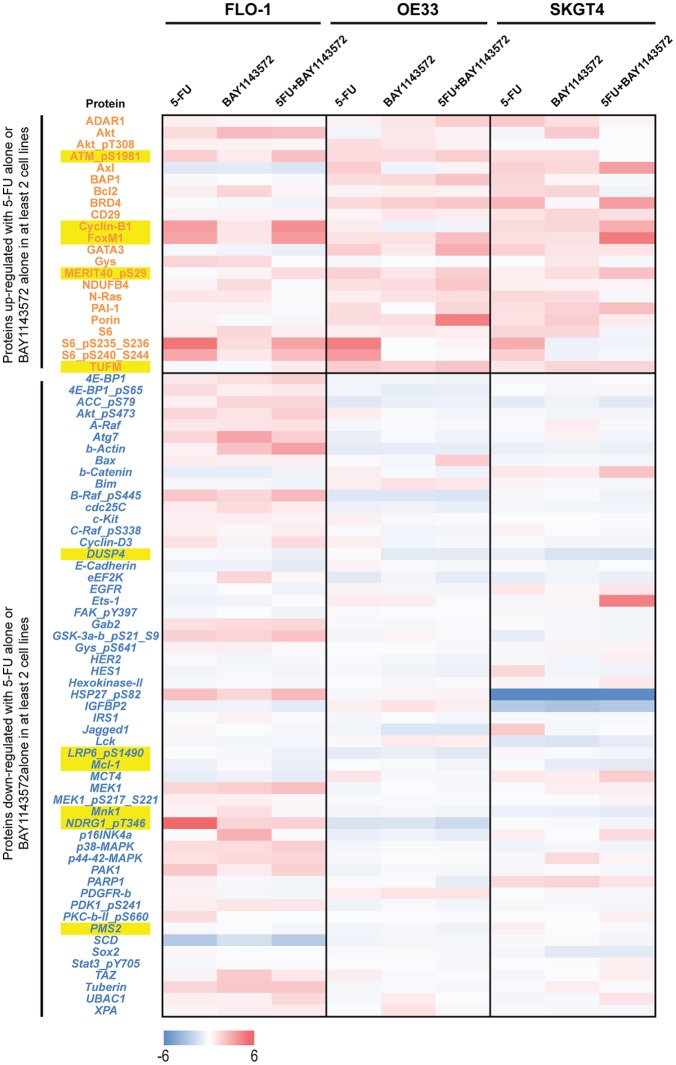
Figure 3.
Effects of BAY1143572 with or without 5-fluorouracil on the proteomics profile of esophageal adenocarcinoma. Lysates from cells treated with 1 µM BAY1143572 with or without 5-fluorouracil (10 µM for OE33 and SKGT4 cells, 5 µM for FLO-1 cells) for 30 h were subjected to reverse phase protein array (RPPA) analysis. Protein-level data were normalized for protein loading and transformed to linear values. The heat map indicates the difference in the linear values between control (vehicle treatment only) and the treatment groups. The blue indicating negative (<0) difference between control and the treatment group indicating reduction in the protein and red indicating positive (>0) difference between control and the treatment group indicating increase in the protein expression. Proteins in red font are upregulated oncoproteins after treatment with either 5-fluorouracil or BAY1143572 in at least two cell lines. Proteins in blue font are downregulated oncoproteins after treatment with either 5-fluorouracil or BAY1143572 in at least two cell lines. Yellow highlighted proteins are those with higher upregulation or downregulation after treatment with BAY1143572 plus 5-fluorouracil as compared with single-agent treatment in at least two cell lines.

