Fig. 3.
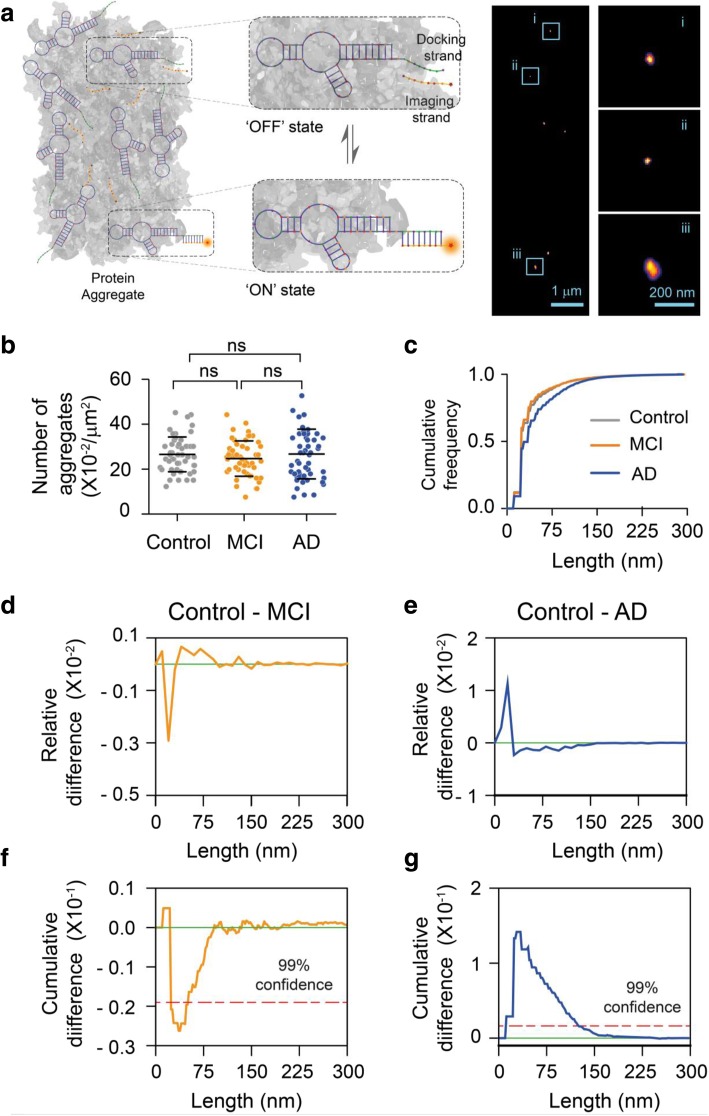
Super-resolution imaging of aggregates present in CSF using AD-PAINT. a Schematic of AD PAINT. Dye-labelled DNA imaging strands transiently bind to their complementary target sequence (docking strand), which is attached to a protein aggregate via aptamer. This transient binding between imaging and docking strand is detected. Repeated cycles of binding and unbinding allows a super-resolved image of individual protein aggregate present in CSF to be determined. The right image shows examples of super-resolved image of protein aggregates from CSF. Three individual protein aggregates present in CSF are enlarged. The lengths of the aggregates shown are: (i) 47 nm, (ii) 34 nm and (iii) 118 nm. b Number of aggregates present in control, MCI and AD CSF samples. Each point represents one field of view. c Cumulative frequency histograms of the size distributions of all aggregates measured. d, e Differences between normalised histograms of the size distributions of the indicated CSF samples. f, g Differences between the cumulative frequency histograms of the size distributions of the indicated CSF samples. The dotted line indicates 99% confidence using the Kolmogorov-Smirnov statistical test. (n = 6 AD, 6 MCI, 6 control CSF)

