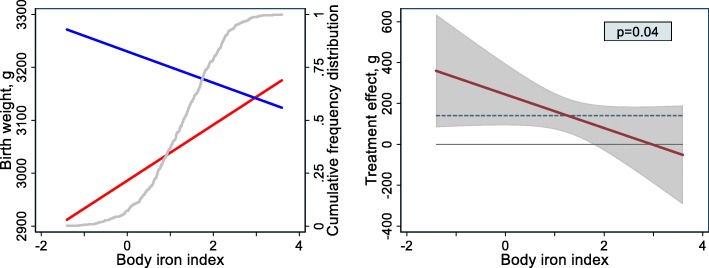
Fig. 1.
Effect of antenatal iron supplementation on neonatal birth weight in Kenya, by iron status at baseline. Iron status is indicated by body iron index, i.e. the natural logarithm of the ratio of plasma concentrations of ferritin (μg/L) and soluble transferrin receptor (mg/L), both adjusted for inflammation and Plasmodium infection (see text). Effects were adjusted for HIV infection and parity; other covariates were eliminated in the multiple fractional polynomial regression (mfpi) procedure. Based on analysis of 391 Kenyan women. Left panel: Associations between birth weight and body iron index for women who received supplementation with iron (blue line) or placebo (red line). The difference between these lines is the treatment effect (i.e. the difference in mean birth weight between the iron group and the placebo group, with the placebo group used as the reference) conditional to body iron index. The cumulative relative frequency distribution of the body iron index is indicated by the grey line (and right Y-axis); 95% of women had values in the range between − 0.55 and 2.82. Right panels: treatment effect as a function of body iron index, with corresponding 95% confidence bands and p value for interaction. The horizontal solid line indicates zero effect, whilst the horizontal dashed line indicates the intervention effect as measured in a regression model without covariates other than the intervention (140 g)

