Fig. 5.

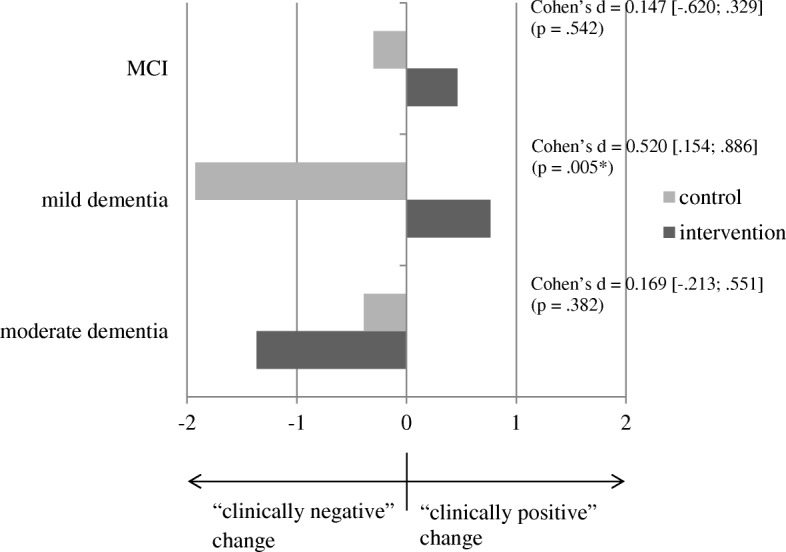
Illustration of effects based on difference scores (t2-t0) for depressiveness (operationalized as “well-being”) – by subgroups characterized by different levels of severity of cognitive impairment

Illustration of effects based on difference scores (t2-t0) for depressiveness (operationalized as “well-being”) – by subgroups characterized by different levels of severity of cognitive impairment