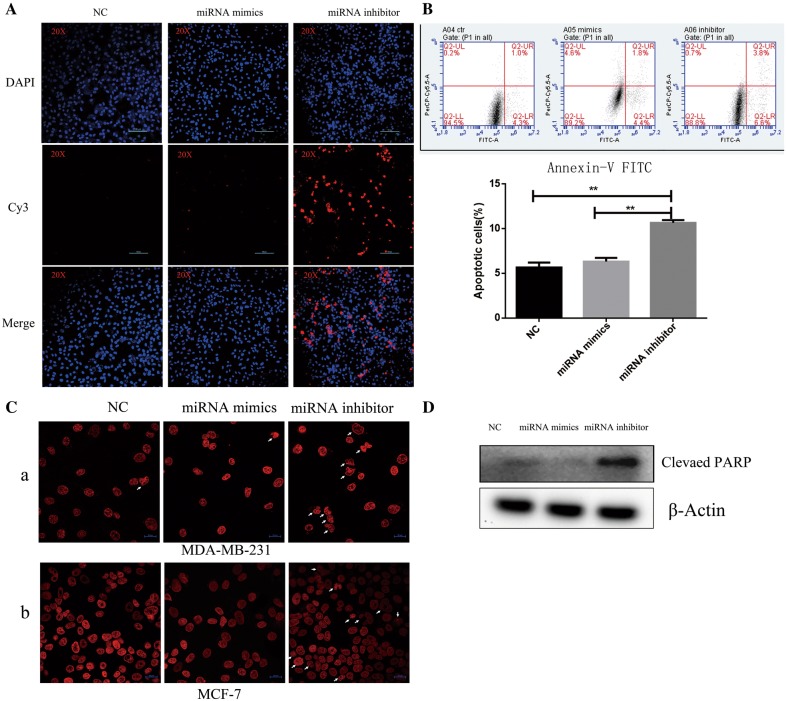
Fig. 4.
miR-29b-3p inhibitor induces apoptosis. A TUNEL assay. The nuclei were visualized by staining with DAPI (blue), Cy3-labeled the apoptosis cells (red). Image magnification: ×20. B Annexin V-FITC and propidium iodide assay. The sum of early and late apoptotic cells ratio (%) were quantitated by flow cytometer analysis of Annexin V/PI. C Hoechst staining. (a) MDA-MB-231; (b) MCF-7. White arrows indicate the cells nuclear fragmentation. The nuclei were visualized by staining with Hoechst (red). Image magnification: ×40. D Western blot for Cleaved PARP. Data are presented as the mean ± SD of three independent experiments. The data represents three experiments exhibiting similar results

