
Figure 10.

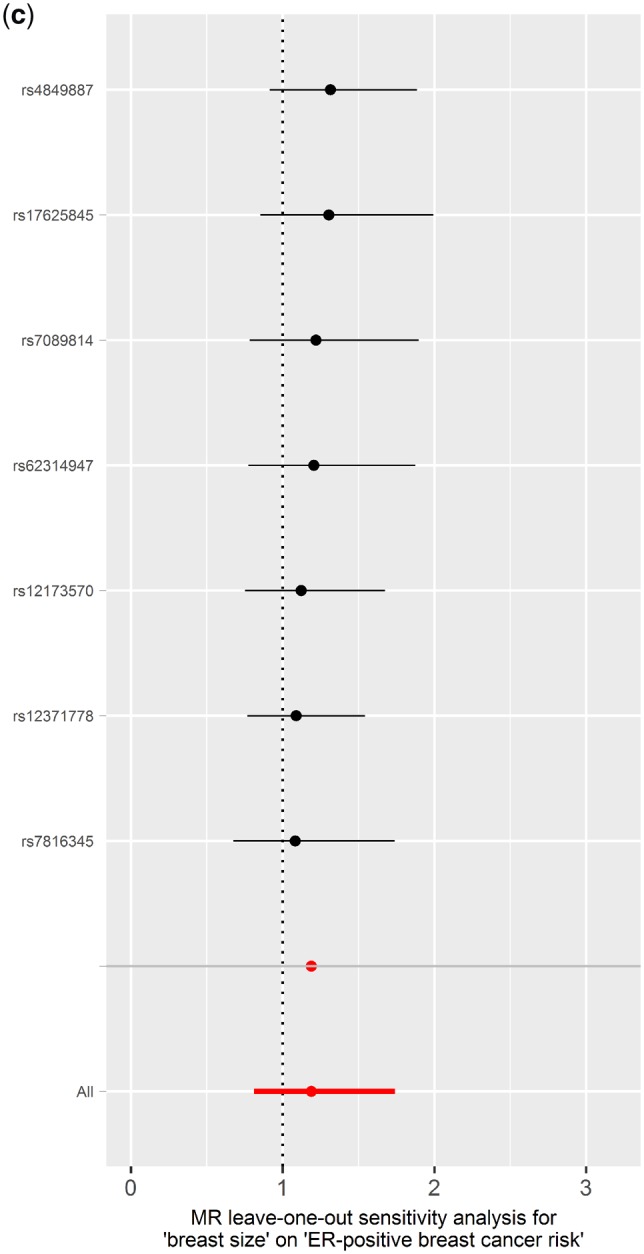
Leave-one-out permutation analysis plots for (a) overall breast cancer risk, (b) oestrogen receptor (ER)-positive breast cancer risk, and (c) ER-negative breast cancer risk obtained by leaving out the SNP indicated and repeating the standard inverse-variance weighted method with the six SNP instrumental variables used respectively.