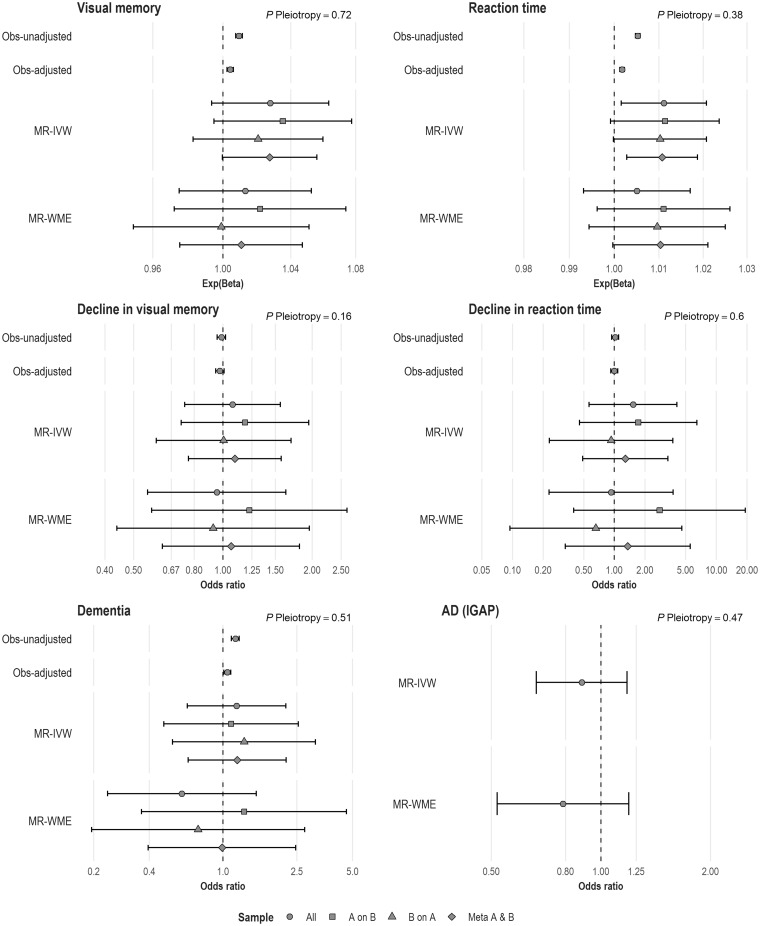
Figure 2.
Results from observational and Mendelian randomization analyses.
Numbers represent effect size per additional hour/day of sleep duration; Exp(Beta), exponentiated beta (represents multiplicative effect size, e.g. an exponentiated beta of 1.03 in reaction time represents an estimated 3% increased/slower reaction time); P Pleiotropy, P-value for overall horizontal pleiotropic effect as indicated by the intercept from MR-Egger regression; Obs-unadjusted, unadjusted observational analysis; Obs-adjusted, observational analysis adjusted for age, sex, socio-economic status, qualification, employment, smoking status, alcohol-intake frequency, body mass index, hypertension, co-morbidities and use of sleep-inducing medication; MR-IVW, Mendelian randomization, inverse-variance-weighted; MR-WME, Mendelian randomization, weighted median estimator.

