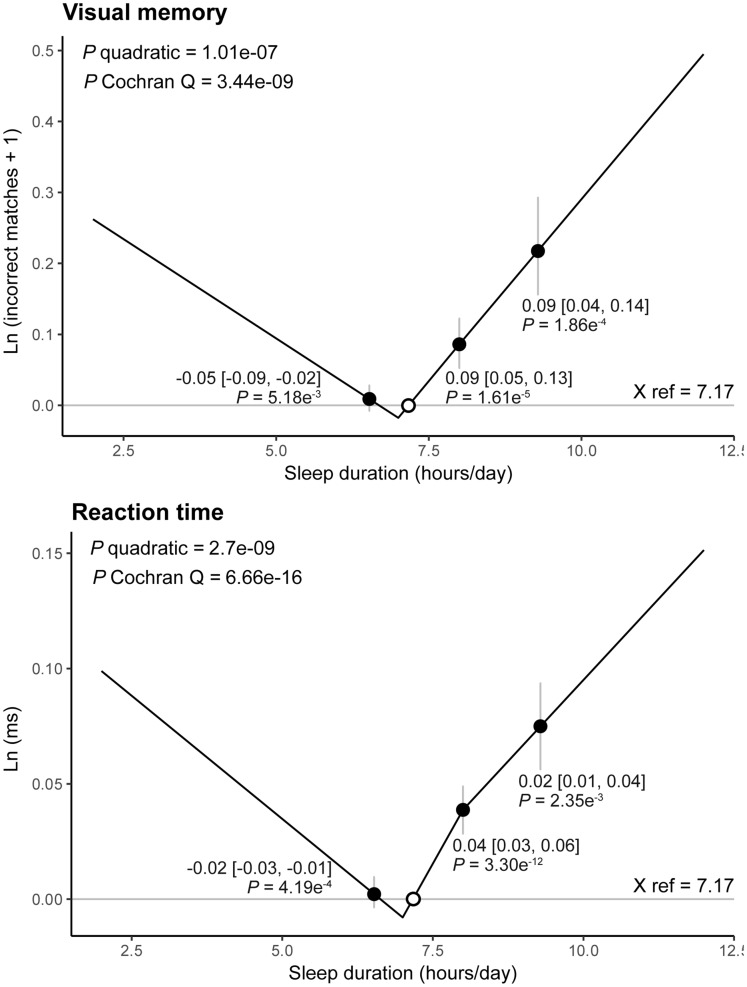
Figure 3.
Non-linear Mendelian randomization results with piecewise linear method using three strata of sleep duration conditioned on the genetic instruments.
Annotated numbers [black dots (grey vertical lines)] represent localized average causal effect (95% confidence interval) in each stratum; white dots, mean sleep duration used as reference point (X ref); P quadratic/Cochran Q, P-value for non-linearity from quadratic/Cochran Q test; Ln (incorrect matches + 1), natural log of [number of incorrect matches (errors made) in visual-memory test + 1]; Ln (ms), natural log milliseconds of reaction time.

