Figure 4.

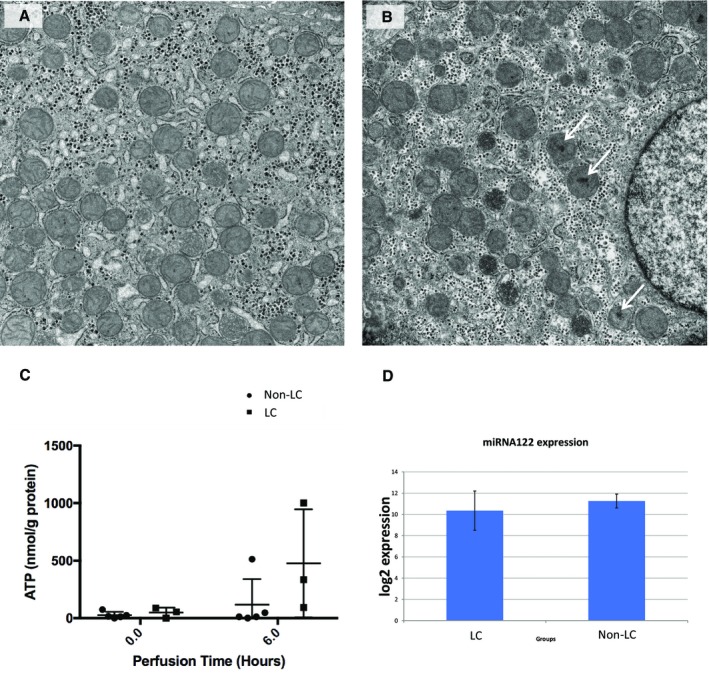
Transmission electron micrographs and ATP and miRNA analyses. (A) shows a LC, viable liver number 4, and (B) a non‐LC liver number 6. Both microphotographs were taken from postperfusion (T6) biopsy samples. In the nonviable liver, flocculent densities can be seen within several of the mitochondria (white arrows), which indicate irreversible cell injury. Christae are still apparent within other mitochondria and within the viable liver (A) in which no flocculent densities were observed. The mitochondria of both livers are not swollen (original magnification ×13,000). (C) Preperfusion and postperfusion ATP levels, showing increase in the LC livers contrasting with minimal change observed in non‐LC livers. (D) MiRNA assays to assess the extent of cellular damage. This analysis did not reveal any difference between LC and non‐LC groups.
