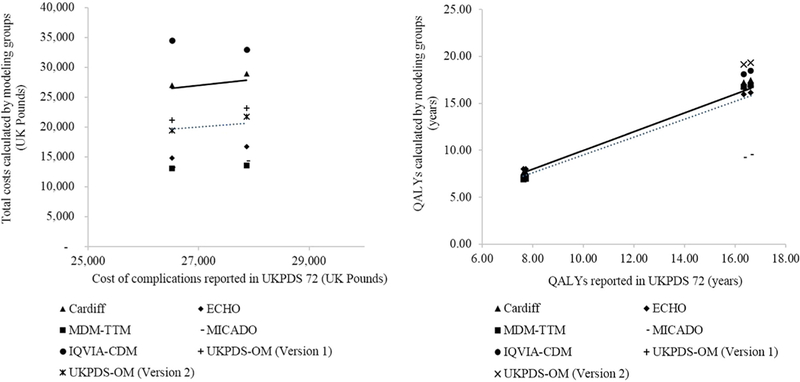
Fig. 2 –

Comparisons of total costs and QALYs vs. the UKPDS 72 study [14]. Each scatterplot denotes a comparison of results from the modeling groups and those from the UKPDS 72 study. The dotted line is the fitted linear regression line, and the solid line denotes hypothetical perfect agreement between values generated from the modeling groups and those from the original study, that is, R2 = 1 and line intersecting the origin (0). Overall, there is a good agreement between the results from the modeling groups and those from the UKPDS 72 study. The slopes of the regression line are 0.75 and 0.98 and the R2 are 0.89 and 0.97 for the comparisons of total costs and QALYs, respectively. ECHO, Economics and Health Outcomes Model of T2DM; MDM-TTM, Medical Decision Modeling Inc.—Treatment Transitions Model; QALY, quality-adjusted life-year; IQVIA-CDM, IQVIA-Core Diabetes Model; T2DM, type 2 diabetes mellitus; UKPDS, UK Prospective Diabetes Study; UKPDS-OM, UKPDS Outcomes Model.
