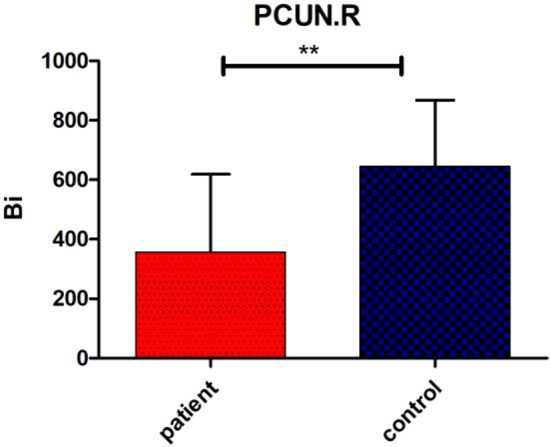
Figure 3.

Significant group difference in betweenness centrality value (Bi) of right precuneus (PCUN.R). Bars and error bars indicate the mean and standard deviation. The asterisk marks indicates a significant difference between the two groups (p < 0.05; false discovery rate corrected).
