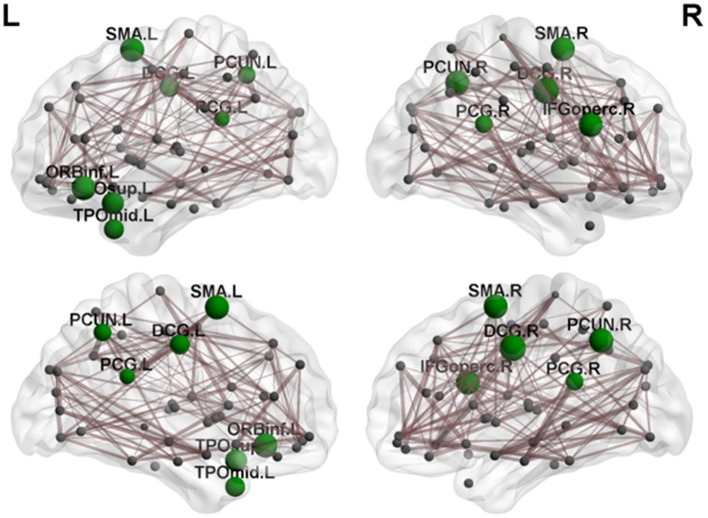
Figure 4.
By comparing nodal efficiency between the cerebellar infarction and control group, 12 brain regions with significant differences (P < 0.05, false discovery rate corrected) between the two groups are shown in green. Node sizes represent the significance of between-group differences in regional nodal efficiency. For the abbreviations of the regions, please see Table 3.

