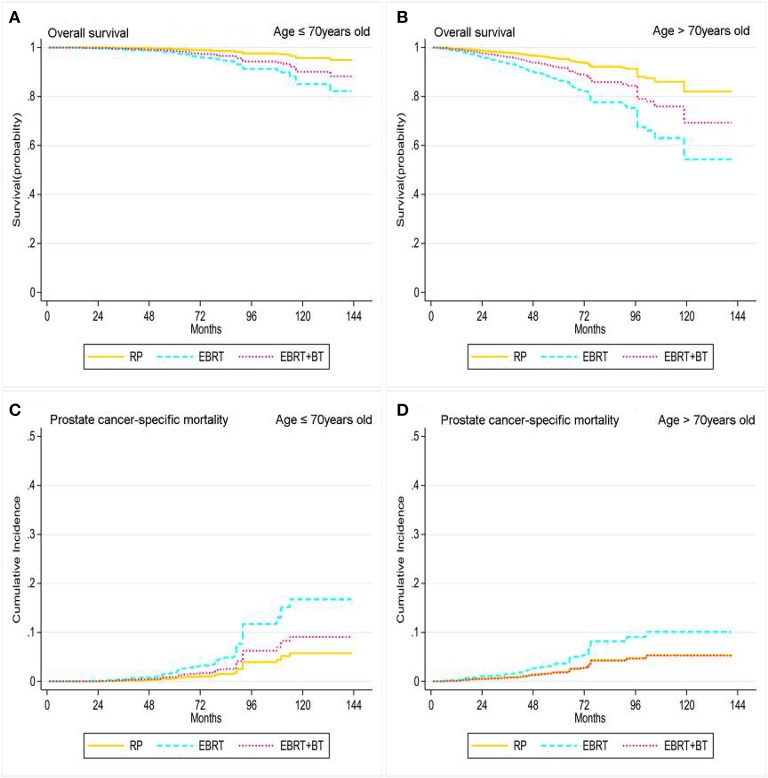
Figure 3.
Adjusted survival curves for overall survival (A, age ≤ 70 years old; B, age > 70 years old) and prostate cancer-specific mortality (C, age ≤ 70 years old; D, age > 70 years old) by RP, EBRT, and EBRT+BT treatment options after weighting in age subgroups after weighting (adjusted curves after stratified by RP, EBRT, and EBRT+BT treatment options were generated by adding marital status, race, at diagnosis, disease stage, PSA level, and GS into the Cox proportional hazards model or competing risks regression model, respectively).

