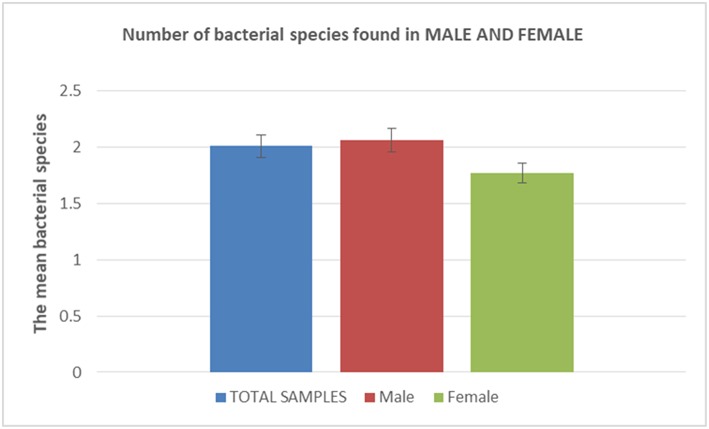
Figure 2.
Number of bacterial species found in males and females. The histogram is showing the mean number of bacterial species accordingly to males/females status. In blue characters: Total number of samples; in red characters: total number of sample in male patients; in green characters: total number of samples in female patients.

