
Figure 3.
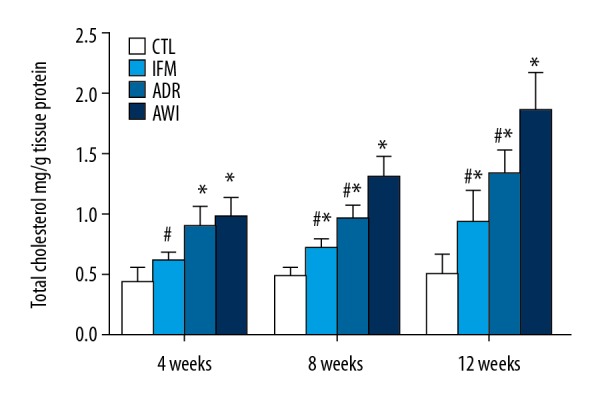
TC levels of the kidneys in the 4 groups at 4, 8, and 12 weeks. Values represent means ± standard errors of mean for groups of 8 mice each. For comparisons at the same time point: * P<0.05 versus CTL group, # P<0.05 versus AWI group. TC – total cholesterol; CTL – control group; AWI group – Adriamycin-induced nephrosis with inflammation group.