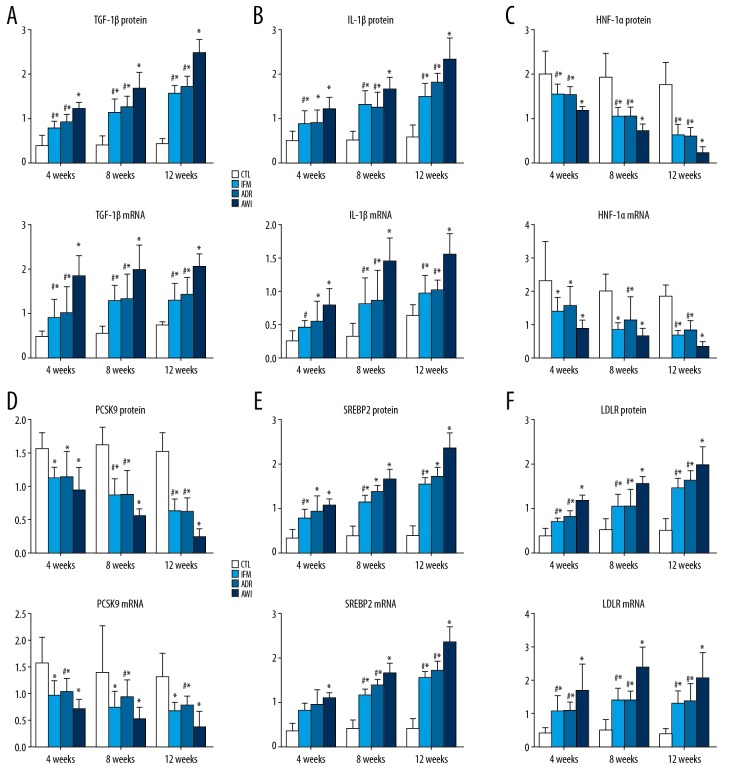
Figure 4.
(A–F) Renal expression of TGF-β1, IL-1β, HNF1α, PCSK9, LDLR, and SREBP2 proteins (immunohistochemical analysis software was used to analyze the optical density values in the images, and semi-quantitative values of positive expression in kidney tissues were obtained) and mRNAs (from RT-qPCR, relative to GAPDH) in the 4 groups at 4, 8, and 12 weeks. Values represent means ± standard errors of mean for groups of 8 mice each. For comparisons at the same time point: * P<0.05 versus CTL, # P<0.05 versus AWI. TGF-β1 – transforming growth factor beta 1; IL-1β – interleukin 1β; HNF1α – hepatocyte nuclear factor 1α; PCSK9 – pro-protein convertase subtilisin kexin type 9; LDLR – low-density lipoprotein receptor; SREBP2 – sterol regulatory element binding protein 2; RT-q-PCR – real-time quantitative polymerase chain reaction; GAPDH – glyceraldehyde 3-phosphate dehydrogenase; CLT – control group; AWI group – Adriamycin-induced nephrosis with inflammation group.

