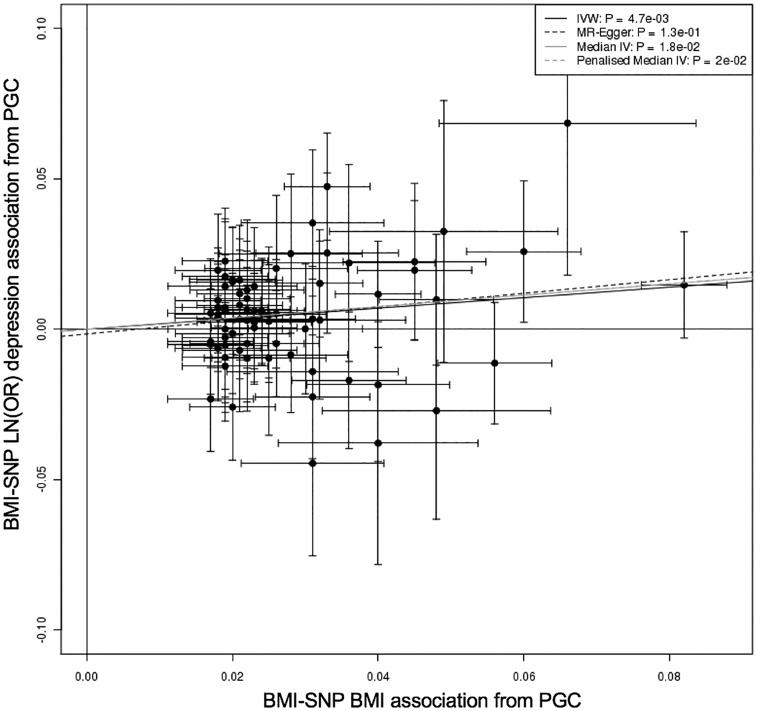
Figure 5.
Plot of the individual BMI variant—BMI associations from the primary GWAS that did not include UK Biobank22 against the BMI variant—depression associations on natural log scale (LN(OR)) from the PGC GWAS data excluding the UK Biobank. The beta regression coefficients for inverse variance weighted (IVW) instrumental analysis (black solid), Egger-MR (black dash),33 median-IV (grey solid) and the penalized weight median IV (grey dash) are plotted.

