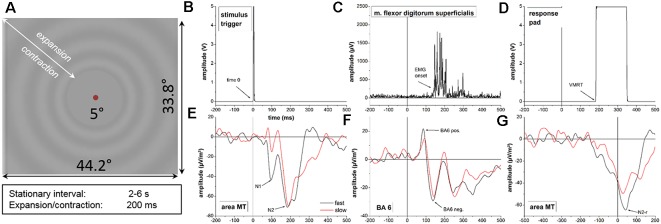
Figure 1.
(A) Radial visual motion onset stimulus used in this experiment. (B–G) Representative data of a single subject during the visuomotor reaction experiment. Data values for the stimulus trigger (B), electromyographic (EMG) onset (C) and the response pad (D) are displayed for a single trial of the fast motion onset condition. Time-locked neurophysiological activity in area MT (E) and BA6 (F) as well as response-locked data in are MT (F) represent averaged time courses of cortical activity across single trials for the slow (red line) and fast (black line) motion onset condition. Behavioral and neurophysiological parameters investigated in the experiment are highlighted with arrows. Note the different scaling on the x-axis for the response-locked activity in area MT (G) due to different segmentation. Time 0 = stimulus onset; VMRT = visuomotor reaction time (button press); BA6 pos. = BA6 positivity; BA6 neg. = BA6 negativity.

