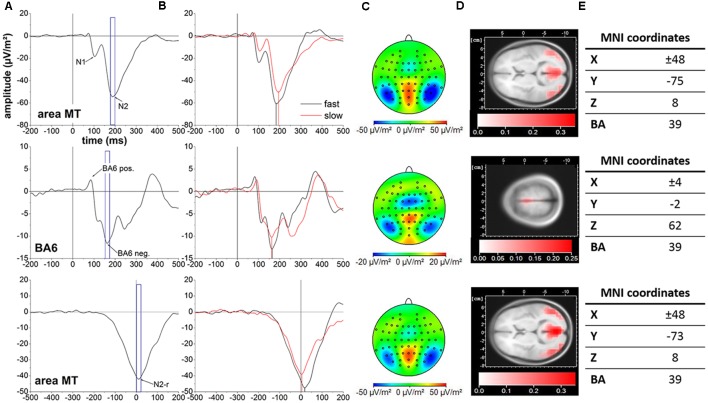
Figure 2.
Cortical activity averaged across all 37 subjects. Top row: stimulus-locked data in area MT. Middle row: stimulus-locked data in BA6. Bottom row: response-locked date in area MT. The event-related potentials (ERPs) of interest are indicated with arrows. Blue frames represent the 20 ms peri-peak window centered at the N2 (A), BA6 negativity (B) and N2-r (C) potentials forming the basis for cortical mappings and LORETA localization in (C) and (D), respectively. (B) Cortical activity for the slow (red line) and fast (black line) motion onset condition. Vertical black and red lines illustrate the temporal projection of the N2, BA6 negativity and N2-r potentials. (C) Cortical mappings reflecting the N2, BA6 negativity and N2-r potentials based on the 20 ms peri-peak windows in (A). (D) LORETA localization of the N2, BA6 negativity and N2-r potentials based on the 20 ms peri-peak windows in (A). (E) LORETA based MNI coordinates and corresponding Brodmann areas (BA) representing the location of maximal cortical activity associated with the N2, BA6 negativity and N2-r potentials. Please note the differences in scaling between cortical activity in area MT and BA6 for cortical mappings and LORETA localization.

