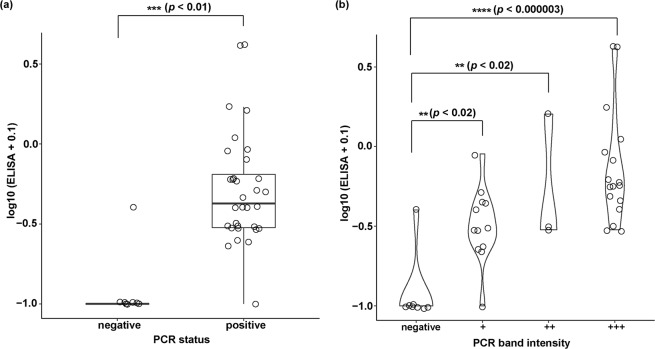
Figure 4.
Box plot (a) and violin plot (b) representing log-transformed anatoxin-a (µg · L−1) measured by ELISA (Y-axis) corresponding to nested PCR results (X-axis) of 40 cyanobacterial bloom samples. The grey line across the box (A) indicates the median anatoxin-a concentration. Asteriks (*) represent statistical significance (p < 0.05). PCR band intentisities (B) were indicated by faint (+), strong (++) and very strong (+++) bands.

