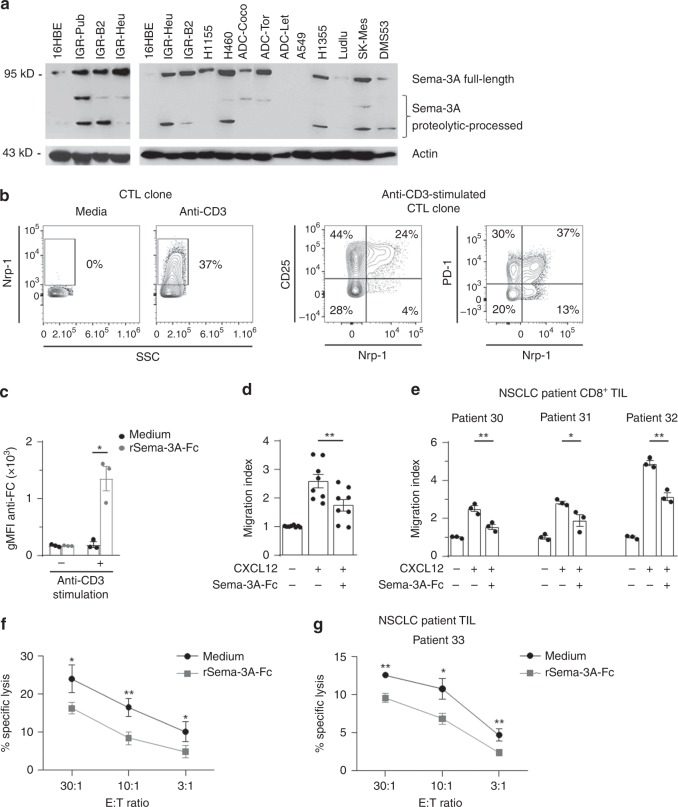
Fig. 2.
Expression of Sema-3A and Nrp-1 in human lung tumour cell lines and CTL clone. a Sema-3A expression in human lung tumour cell lines. Total protein extracts were analysed by western blot using anti-Sema-3A mAb. The 16HBE cell line was included as a control. Full length and proteolytically processed proteins are indicated. b Co-expression of Nrp-1 and CD25, and Nrp-1 and PD-1 on P62 T cells stimulated with immobilised anti-CD3. c The P62 clone was unstimulated or stimulated with anti-CD3, pre-incubated with Sema-3A-Fc, and then labelled with anti-human IgG-Fc secondary mAb. Results are gMFI mean ± SEM of triplicate samples. d Sema-3A-Fc inhibits CTL migration toward a CXCL12 gradient. The T-cell clone was stimulated with anti-CD3, pre-incubated with BSA or Sema-3A-Fc, and then seeded in the upper chambers of transwell plates and exposed to a gradient of CXCL12 loaded in the lower chambers. The number of T cells that had migrated into the lower chambers was determined. Results are mean chemotaxis index ± SEM of triplicate samples. e Sema-3A-Fc inhibits CD8+ TIL migration toward CXCL12. CD8+ TIL isolated from three human NSCLC tumours were stimulated with anti-CD3, pre-incubated with BSA or Sema-3A-Fc, and then seeded in the upper chambers of transwells and exposed to a CXCL12 gradient. Results are mean chemotaxis index ± SEM of triplicates. f Cytotoxicity of the CTL clone toward autologous tumour cells. The P62 clone was stimulated with anti-CD3, pre-incubated in medium or with Sema-3A-Fc. Cytotoxicity toward the cognate IGR-Pub cell line was determined. g Cytotoxic activity of freshly isolated TIL toward autologous tumour cells. TIL, freshly isolated from a NSCLC tumour, were stimulated with anti-CD3, pre-incubated in medium or with Sema-3A-Fc. Cytotoxicity toward freshly isolated autologous tumour cells was determined. Data shown for cytotoxic assay correspond to one of three independent experiments. Means ± SEM two-tailed Student’s paired t test c, one-way ANOVA test with Bonferroni correction d, e or two-way ANOVA test with Bonferroni correction f, g. *P < 0.05; **P < 0.01; ***P < 0.001. Source data are provided as a Source Data file a

